
When designing a filter with a prescribed magnitude response by the Bode ``stick diagram'' method, we think in terms of poles and zeros ``breaking'' at certain frequencies. For example, in the term
which is scaled to have unity gain at
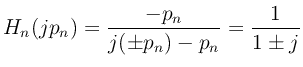
which has magnitude
The Bode design procedure is then to start at dc (![]() ) and map
out break-frequencies for poles and zeros so as to follow the desired
response as closely as desired. Since this tool is commonly applied
in control-system design, there is also usually consideration for the
phase plot as well, which has similarly simple
behavior.17
) and map
out break-frequencies for poles and zeros so as to follow the desired
response as closely as desired. Since this tool is commonly applied
in control-system design, there is also usually consideration for the
phase plot as well, which has similarly simple
behavior.17
The basic Bode ``stick diagram'' consists only of straight line
segments, each having slope given by some integer number of nepers per
neper (or integer multiple of ![]() dB/octave, etc.), with the
knowledge that the actual response will be a smoothed version of the
stick diagram, traversing the
dB/octave, etc.), with the
knowledge that the actual response will be a smoothed version of the
stick diagram, traversing the ![]() dB points at line-segment
intersections corresponding to isolated breaking zeros and poles,
respectively.
dB points at line-segment
intersections corresponding to isolated breaking zeros and poles,
respectively.