A Bode Plot of a filter frequency response
![]() separately graphs the log-magnitude and phase versus
log-frequency.16We are only concerned here with log-magnitude plots, and will omit
consideration of the Bode phase plot, which happen to behave as
expected naturally. The usual choice of log-magnitude units is
decibels (dB)
separately graphs the log-magnitude and phase versus
log-frequency.16We are only concerned here with log-magnitude plots, and will omit
consideration of the Bode phase plot, which happen to behave as
expected naturally. The usual choice of log-magnitude units is
decibels (dB)
![]() (relative to an arbitrary reference, such as
(relative to an arbitrary reference, such as ![]() ), and the
log-frequency axis is typically either in octaves
(
), and the
log-frequency axis is typically either in octaves
(
![]() ) or decades
(
) or decades
(
![]() ). Thus, a single pole is said to give a
roll-off of
). Thus, a single pole is said to give a
roll-off of ![]() dB per octave or
dB per octave or ![]() dB per decade. Octaves are
typical in audio signal processing while decades are typical in the
field of automatic control.
dB per decade. Octaves are
typical in audio signal processing while decades are typical in the
field of automatic control.
![\begin{figure}[scale=2, transform shape]
\centering
\begin{tikzpicture}[gnuplot, scale=1.5, transform shape]
\path (0.000,0.000) rectangle (8.000,6.000);
\gpfill{rgb color={1.000,1.000,1.000}} (1.320,0.985)--(7.446,0.985)--(7.446,5.630)--(1.320,5.630)--cycle;
\gpcolor{color=gp lt color axes}
\gpsetlinetype{gp lt axes}
\gpsetdashtype{gp dt axes}
\gpsetlinewidth{0.50}
\draw[gp path] (1.320,0.985)--(7.447,0.985);
\gpcolor{color=gp lt color border}
\gpsetlinetype{gp lt border}
\gpsetdashtype{gp dt solid}
\draw[gp path] (1.320,0.985)--(1.571,0.985);
\draw[gp path] (7.447,0.985)--(7.196,0.985);
\gpcolor{rgb color={0.000,0.000,0.000}}
\node[gp node right,font={\fontsize{10.0pt}{12.0pt}\selectfont}] at (1.136,0.985) {-20};
\gpcolor{color=gp lt color axes}
\gpsetlinetype{gp lt axes}
\gpsetdashtype{gp dt axes}
\draw[gp path] (1.320,2.147)--(7.447,2.147);
\gpcolor{color=gp lt color border}
\gpsetlinetype{gp lt border}
\gpsetdashtype{gp dt solid}
\draw[gp path] (1.320,2.147)--(1.571,2.147);
\draw[gp path] (7.447,2.147)--(7.196,2.147);
\gpcolor{rgb color={0.000,0.000,0.000}}
\node[gp node right,font={\fontsize{10.0pt}{12.0pt}\selectfont}] at (1.136,2.147) {-15};
\gpcolor{color=gp lt color axes}
\gpsetlinetype{gp lt axes}
\gpsetdashtype{gp dt axes}
\draw[gp path] (1.320,3.308)--(7.447,3.308);
\gpcolor{color=gp lt color border}
\gpsetlinetype{gp lt border}
\gpsetdashtype{gp dt solid}
\draw[gp path] (1.320,3.308)--(1.571,3.308);
\draw[gp path] (7.447,3.308)--(7.196,3.308);
\gpcolor{rgb color={0.000,0.000,0.000}}
\node[gp node right,font={\fontsize{10.0pt}{12.0pt}\selectfont}] at (1.136,3.308) {-10};
\gpcolor{color=gp lt color axes}
\gpsetlinetype{gp lt axes}
\gpsetdashtype{gp dt axes}
\draw[gp path] (1.320,4.470)--(7.447,4.470);
\gpcolor{color=gp lt color border}
\gpsetlinetype{gp lt border}
\gpsetdashtype{gp dt solid}
\draw[gp path] (1.320,4.470)--(1.571,4.470);
\draw[gp path] (7.447,4.470)--(7.196,4.470);
\gpcolor{rgb color={0.000,0.000,0.000}}
\node[gp node right,font={\fontsize{10.0pt}{12.0pt}\selectfont}] at (1.136,4.470) {-5};
\gpcolor{color=gp lt color axes}
\gpsetlinetype{gp lt axes}
\gpsetdashtype{gp dt axes}
\draw[gp path] (1.320,5.631)--(7.447,5.631);
\gpcolor{color=gp lt color border}
\gpsetlinetype{gp lt border}
\gpsetdashtype{gp dt solid}
\draw[gp path] (1.320,5.631)--(1.571,5.631);
\draw[gp path] (7.447,5.631)--(7.196,5.631);
\gpcolor{rgb color={0.000,0.000,0.000}}
\node[gp node right,font={\fontsize{10.0pt}{12.0pt}\selectfont}] at (1.136,5.631) {0};
\gpcolor{color=gp lt color axes}
\gpsetlinetype{gp lt axes}
\gpsetdashtype{gp dt axes}
\draw[gp path] (1.320,0.985)--(1.320,5.631);
\gpcolor{color=gp lt color border}
\gpsetlinetype{gp lt border}
\gpsetdashtype{gp dt solid}
\draw[gp path] (1.320,0.985)--(1.320,1.236);
\draw[gp path] (1.320,5.631)--(1.320,5.380);
\gpcolor{rgb color={0.000,0.000,0.000}}
\node[gp node center,font={\fontsize{10.0pt}{12.0pt}\selectfont}] at (1.320,0.677) {$10^{-1}$};
\gpcolor{color=gp lt color axes}
\gpsetlinetype{gp lt axes}
\gpsetdashtype{gp dt axes}
\draw[gp path] (2.242,0.985)--(2.242,1.165);
\draw[gp path] (2.242,1.935)--(2.242,5.631);
\gpcolor{color=gp lt color border}
\gpsetlinetype{gp lt border}
\gpsetdashtype{gp dt solid}
\draw[gp path] (2.242,0.985)--(2.242,1.110);
\draw[gp path] (2.242,5.631)--(2.242,5.506);
\gpcolor{color=gp lt color axes}
\gpsetlinetype{gp lt axes}
\gpsetdashtype{gp dt axes}
\draw[gp path] (2.782,0.985)--(2.782,1.165);
\draw[gp path] (2.782,1.935)--(2.782,5.631);
\gpcolor{color=gp lt color border}
\gpsetlinetype{gp lt border}
\gpsetdashtype{gp dt solid}
\draw[gp path] (2.782,0.985)--(2.782,1.110);
\draw[gp path] (2.782,5.631)--(2.782,5.506);
\gpcolor{color=gp lt color axes}
\gpsetlinetype{gp lt axes}
\gpsetdashtype{gp dt axes}
\draw[gp path] (3.164,0.985)--(3.164,1.165);
\draw[gp path] (3.164,1.935)--(3.164,5.631);
\gpcolor{color=gp lt color border}
\gpsetlinetype{gp lt border}
\gpsetdashtype{gp dt solid}
\draw[gp path] (3.164,0.985)--(3.164,1.110);
\draw[gp path] (3.164,5.631)--(3.164,5.506);
\gpcolor{color=gp lt color axes}
\gpsetlinetype{gp lt axes}
\gpsetdashtype{gp dt axes}
\draw[gp path] (3.461,0.985)--(3.461,1.165);
\draw[gp path] (3.461,1.935)--(3.461,5.631);
\gpcolor{color=gp lt color border}
\gpsetlinetype{gp lt border}
\gpsetdashtype{gp dt solid}
\draw[gp path] (3.461,0.985)--(3.461,1.110);
\draw[gp path] (3.461,5.631)--(3.461,5.506);
\gpcolor{color=gp lt color axes}
\gpsetlinetype{gp lt axes}
\gpsetdashtype{gp dt axes}
\draw[gp path] (3.704,0.985)--(3.704,1.165);
\draw[gp path] (3.704,1.935)--(3.704,5.631);
\gpcolor{color=gp lt color border}
\gpsetlinetype{gp lt border}
\gpsetdashtype{gp dt solid}
\draw[gp path] (3.704,0.985)--(3.704,1.110);
\draw[gp path] (3.704,5.631)--(3.704,5.506);
\gpcolor{color=gp lt color axes}
\gpsetlinetype{gp lt axes}
\gpsetdashtype{gp dt axes}
\draw[gp path] (3.909,0.985)--(3.909,1.165);
\draw[gp path] (3.909,1.935)--(3.909,5.631);
\gpcolor{color=gp lt color border}
\gpsetlinetype{gp lt border}
\gpsetdashtype{gp dt solid}
\draw[gp path] (3.909,0.985)--(3.909,1.110);
\draw[gp path] (3.909,5.631)--(3.909,5.506);
\gpcolor{color=gp lt color axes}
\gpsetlinetype{gp lt axes}
\gpsetdashtype{gp dt axes}
\draw[gp path] (4.087,0.985)--(4.087,1.165);
\draw[gp path] (4.087,1.935)--(4.087,5.631);
\gpcolor{color=gp lt color border}
\gpsetlinetype{gp lt border}
\gpsetdashtype{gp dt solid}
\draw[gp path] (4.087,0.985)--(4.087,1.110);
\draw[gp path] (4.087,5.631)--(4.087,5.506);
\gpcolor{color=gp lt color axes}
\gpsetlinetype{gp lt axes}
\gpsetdashtype{gp dt axes}
\draw[gp path] (4.243,0.985)--(4.243,1.165);
\draw[gp path] (4.243,1.935)--(4.243,5.631);
\gpcolor{color=gp lt color border}
\gpsetlinetype{gp lt border}
\gpsetdashtype{gp dt solid}
\draw[gp path] (4.243,0.985)--(4.243,1.110);
\draw[gp path] (4.243,5.631)--(4.243,5.506);
\gpcolor{color=gp lt color axes}
\gpsetlinetype{gp lt axes}
\gpsetdashtype{gp dt axes}
\draw[gp path] (4.384,0.985)--(4.384,1.165);
\draw[gp path] (4.384,1.935)--(4.384,5.631);
\gpcolor{color=gp lt color border}
\gpsetlinetype{gp lt border}
\gpsetdashtype{gp dt solid}
\draw[gp path] (4.384,0.985)--(4.384,1.236);
\draw[gp path] (4.384,5.631)--(4.384,5.380);
\gpcolor{rgb color={0.000,0.000,0.000}}
\node[gp node center,font={\fontsize{10.0pt}{12.0pt}\selectfont}] at (4.384,0.677) {$10^{0}$};
\gpcolor{color=gp lt color axes}
\gpsetlinetype{gp lt axes}
\gpsetdashtype{gp dt axes}
\draw[gp path] (5.306,0.985)--(5.306,5.631);
\gpcolor{color=gp lt color border}
\gpsetlinetype{gp lt border}
\gpsetdashtype{gp dt solid}
\draw[gp path] (5.306,0.985)--(5.306,1.110);
\draw[gp path] (5.306,5.631)--(5.306,5.506);
\gpcolor{color=gp lt color axes}
\gpsetlinetype{gp lt axes}
\gpsetdashtype{gp dt axes}
\draw[gp path] (5.845,0.985)--(5.845,5.631);
\gpcolor{color=gp lt color border}
\gpsetlinetype{gp lt border}
\gpsetdashtype{gp dt solid}
\draw[gp path] (5.845,0.985)--(5.845,1.110);
\draw[gp path] (5.845,5.631)--(5.845,5.506);
\gpcolor{color=gp lt color axes}
\gpsetlinetype{gp lt axes}
\gpsetdashtype{gp dt axes}
\draw[gp path] (6.228,0.985)--(6.228,5.631);
\gpcolor{color=gp lt color border}
\gpsetlinetype{gp lt border}
\gpsetdashtype{gp dt solid}
\draw[gp path] (6.228,0.985)--(6.228,1.110);
\draw[gp path] (6.228,5.631)--(6.228,5.506);
\gpcolor{color=gp lt color axes}
\gpsetlinetype{gp lt axes}
\gpsetdashtype{gp dt axes}
\draw[gp path] (6.525,0.985)--(6.525,5.631);
\gpcolor{color=gp lt color border}
\gpsetlinetype{gp lt border}
\gpsetdashtype{gp dt solid}
\draw[gp path] (6.525,0.985)--(6.525,1.110);
\draw[gp path] (6.525,5.631)--(6.525,5.506);
\gpcolor{color=gp lt color axes}
\gpsetlinetype{gp lt axes}
\gpsetdashtype{gp dt axes}
\draw[gp path] (6.767,0.985)--(6.767,5.631);
\gpcolor{color=gp lt color border}
\gpsetlinetype{gp lt border}
\gpsetdashtype{gp dt solid}
\draw[gp path] (6.767,0.985)--(6.767,1.110);
\draw[gp path] (6.767,5.631)--(6.767,5.506);
\gpcolor{color=gp lt color axes}
\gpsetlinetype{gp lt axes}
\gpsetdashtype{gp dt axes}
\draw[gp path] (6.972,0.985)--(6.972,5.631);
\gpcolor{color=gp lt color border}
\gpsetlinetype{gp lt border}
\gpsetdashtype{gp dt solid}
\draw[gp path] (6.972,0.985)--(6.972,1.110);
\draw[gp path] (6.972,5.631)--(6.972,5.506);
\gpcolor{color=gp lt color axes}
\gpsetlinetype{gp lt axes}
\gpsetdashtype{gp dt axes}
\draw[gp path] (7.150,0.985)--(7.150,5.631);
\gpcolor{color=gp lt color border}
\gpsetlinetype{gp lt border}
\gpsetdashtype{gp dt solid}
\draw[gp path] (7.150,0.985)--(7.150,1.110);
\draw[gp path] (7.150,5.631)--(7.150,5.506);
\gpcolor{color=gp lt color axes}
\gpsetlinetype{gp lt axes}
\gpsetdashtype{gp dt axes}
\draw[gp path] (7.307,0.985)--(7.307,5.631);
\gpcolor{color=gp lt color border}
\gpsetlinetype{gp lt border}
\gpsetdashtype{gp dt solid}
\draw[gp path] (7.307,0.985)--(7.307,1.110);
\draw[gp path] (7.307,5.631)--(7.307,5.506);
\gpcolor{color=gp lt color axes}
\gpsetlinetype{gp lt axes}
\gpsetdashtype{gp dt axes}
\draw[gp path] (7.447,0.985)--(7.447,5.631);
\gpcolor{color=gp lt color border}
\gpsetlinetype{gp lt border}
\gpsetdashtype{gp dt solid}
\draw[gp path] (7.447,0.985)--(7.447,1.236);
\draw[gp path] (7.447,5.631)--(7.447,5.380);
\gpcolor{rgb color={0.000,0.000,0.000}}
\node[gp node center,font={\fontsize{10.0pt}{12.0pt}\selectfont}] at (7.447,0.677) {$10^{1}$};
\gpcolor{color=gp lt color border}
\draw[gp path] (1.320,5.631)--(1.320,0.985)--(7.447,0.985)--(7.447,5.631)--cycle;
\gpcolor{rgb color={0.000,0.000,0.000}}
\node[gp node center,rotate=90,font={\fontsize{10.0pt}{12.0pt}\selectfont}] at (0.246,3.308) {Magnitude (dB)};
\node[gp node center,font={\fontsize{10.0pt}{12.0pt}\selectfont}] at (4.383,0.215) {log10 ( Radian Frequency )};
\gpcolor{color=gp lt color border}
\gpsetlinewidth{1.00}
\draw[gp path] (1.504,1.165)--(1.504,1.935)--(4.812,1.935)--(4.812,1.165)--cycle;
\gpcolor{rgb color={0.000,0.000,0.000}}
\node[gp node right,font={\fontsize{10.0pt}{12.0pt}\selectfont}] at (4.812,1.742) {Filter Gain};
\gpcolor{rgb color={0.000,0.000,1.000}}
\gpsetlinewidth{2.00}
\draw[gp path] (1.688,1.742)--(2.604,1.742);
\draw[gp path] (1.320,5.631)--(1.447,5.629)--(1.563,5.627)--(1.669,5.624)--(1.768,5.621)%
--(1.859,5.619)--(1.945,5.616)--(2.026,5.612)--(2.102,5.609)--(2.174,5.605)--(2.242,5.601)%
--(2.307,5.598)--(2.369,5.593)--(2.428,5.589)--(2.485,5.585)--(2.539,5.580)--(2.591,5.575)%
--(2.641,5.570)--(2.690,5.565)--(2.737,5.560)--(2.782,5.554)--(2.825,5.548)--(2.868,5.543)%
--(2.908,5.537)--(2.948,5.531)--(2.987,5.524)--(3.024,5.518)--(3.061,5.512)--(3.096,5.505)%
--(3.131,5.498)--(3.164,5.491)--(3.197,5.484)--(3.229,5.477)--(3.261,5.470)--(3.291,5.462)%
--(3.321,5.455)--(3.350,5.447)--(3.379,5.440)--(3.407,5.432)--(3.434,5.424)--(3.461,5.416)%
--(3.488,5.408)--(3.513,5.400)--(3.539,5.391)--(3.564,5.383)--(3.588,5.374)--(3.612,5.366)%
--(3.636,5.357)--(3.659,5.348)--(3.682,5.340)--(3.704,5.331)--(3.726,5.322)--(3.747,5.313)%
--(3.769,5.304)--(3.790,5.295)--(3.810,5.285)--(3.831,5.276)--(3.851,5.267)--(3.870,5.258)%
--(3.890,5.248)--(3.909,5.239)--(3.928,5.229)--(3.946,5.220)--(3.965,5.210)--(3.983,5.200)%
--(4.001,5.191)--(4.018,5.181)--(4.036,5.171)--(4.053,5.162)--(4.070,5.152)--(4.087,5.142)%
--(4.103,5.132)--(4.119,5.122)--(4.136,5.112)--(4.152,5.102)--(4.167,5.092)--(4.183,5.082)%
--(4.198,5.072)--(4.213,5.062)--(4.228,5.052)--(4.243,5.042)--(4.258,5.032)--(4.273,5.022)%
--(4.287,5.012)--(4.301,5.002)--(4.315,4.992)--(4.329,4.982)--(4.343,4.972)--(4.357,4.962)%
--(4.370,4.952)--(4.384,4.942)--(4.397,4.932)--(4.410,4.922)--(4.423,4.911)--(4.436,4.901)%
--(4.448,4.891)--(4.461,4.881)--(4.474,4.871)--(4.486,4.861)--(4.498,4.851)--(4.510,4.841)%
--(4.522,4.831)--(4.534,4.821)--(4.546,4.811)--(4.558,4.801)--(4.569,4.791)--(4.581,4.781)%
--(4.592,4.771)--(4.604,4.761)--(4.615,4.751)--(4.626,4.741)--(4.637,4.731)--(4.648,4.721)%
--(4.659,4.711)--(4.670,4.702)--(4.680,4.692)--(4.691,4.682)--(4.702,4.672)--(4.712,4.662)%
--(4.722,4.652)--(4.733,4.643)--(4.743,4.633)--(4.753,4.623)--(4.763,4.614)--(4.773,4.604)%
--(4.783,4.594)--(4.793,4.585)--(4.802,4.575)--(4.812,4.565)--(4.822,4.556)--(4.831,4.546)%
--(4.841,4.537)--(4.850,4.527)--(4.859,4.518)--(4.869,4.508)--(4.878,4.499)--(4.887,4.489)%
--(4.896,4.480)--(4.905,4.471)--(4.914,4.461)--(4.923,4.452)--(4.932,4.443)--(4.941,4.433)%
--(4.949,4.424)--(4.958,4.415)--(4.967,4.406)--(4.975,4.396)--(4.984,4.387)--(4.992,4.378)%
--(5.000,4.369)--(5.009,4.360)--(5.017,4.351)--(5.025,4.342)--(5.034,4.333)--(5.042,4.324)%
--(5.050,4.315)--(5.058,4.306)--(5.066,4.297)--(5.074,4.288)--(5.082,4.279)--(5.089,4.271)%
--(5.097,4.262)--(5.105,4.253)--(5.113,4.244)--(5.120,4.236)--(5.128,4.227)--(5.136,4.218)%
--(5.143,4.209)--(5.151,4.201)--(5.158,4.192)--(5.166,4.184)--(5.173,4.175)--(5.180,4.167)%
--(5.188,4.158)--(5.195,4.150)--(5.202,4.141)--(5.209,4.133)--(5.216,4.124)--(5.223,4.116)%
--(5.230,4.108)--(5.237,4.099)--(5.244,4.091)--(5.251,4.083)--(5.258,4.074)--(5.265,4.066)%
--(5.272,4.058)--(5.279,4.050)--(5.286,4.042)--(5.292,4.034)--(5.299,4.025)--(5.306,4.017)%
--(5.312,4.009)--(5.319,4.001)--(5.326,3.993)--(5.332,3.985)--(5.339,3.977)--(5.345,3.969)%
--(5.351,3.961)--(5.358,3.954)--(5.364,3.946)--(5.371,3.938)--(5.377,3.930)--(5.383,3.922)%
--(5.389,3.914)--(5.396,3.907)--(5.402,3.899)--(5.408,3.891)--(5.414,3.884)--(5.420,3.876)%
--(5.426,3.868)--(5.433,3.861)--(5.439,3.853)--(5.445,3.846)--(5.451,3.838)--(5.456,3.830)%
--(5.462,3.823)--(5.468,3.815)--(5.474,3.808)--(5.480,3.801)--(5.486,3.793)--(5.492,3.786)%
--(5.497,3.778)--(5.503,3.771)--(5.509,3.764)--(5.515,3.756)--(5.520,3.749)--(5.526,3.742)%
--(5.532,3.735)--(5.537,3.727)--(5.543,3.720)--(5.548,3.713)--(5.554,3.706)--(5.559,3.699)%
--(5.565,3.692)--(5.570,3.685)--(5.576,3.678)--(5.581,3.670)--(5.587,3.663)--(5.592,3.656)%
--(5.597,3.649)--(5.603,3.642)--(5.608,3.636)--(5.613,3.629)--(5.618,3.622)--(5.624,3.615)%
--(5.629,3.608)--(5.634,3.601)--(5.639,3.594)--(5.644,3.587)--(5.650,3.581)--(5.655,3.574)%
--(5.660,3.567)--(5.665,3.560)--(5.670,3.554)--(5.675,3.547)--(5.680,3.540)--(5.685,3.534)%
--(5.690,3.527)--(5.695,3.520)--(5.700,3.514)--(5.705,3.507)--(5.710,3.501)--(5.715,3.494)%
--(5.720,3.488)--(5.725,3.481)--(5.729,3.475)--(5.734,3.468)--(5.739,3.462)--(5.744,3.455)%
--(5.749,3.449)--(5.753,3.442)--(5.758,3.436)--(5.763,3.430)--(5.768,3.423)--(5.772,3.417)%
--(5.777,3.411)--(5.782,3.404)--(5.786,3.398)--(5.791,3.392)--(5.795,3.386)--(5.800,3.379)%
--(5.805,3.373)--(5.809,3.367)--(5.814,3.361)--(5.818,3.355)--(5.823,3.349)--(5.827,3.342)%
--(5.832,3.336)--(5.836,3.330)--(5.841,3.324)--(5.845,3.318)--(5.850,3.312)--(5.854,3.306)%
--(5.858,3.300)--(5.863,3.294)--(5.867,3.288)--(5.872,3.282)--(5.876,3.276)--(5.880,3.270)%
--(5.884,3.264)--(5.889,3.258)--(5.893,3.252)--(5.897,3.247)--(5.902,3.241)--(5.906,3.235)%
--(5.910,3.229)--(5.914,3.223)--(5.918,3.217)--(5.923,3.212)--(5.927,3.206)--(5.931,3.200)%
--(5.935,3.194)--(5.939,3.189)--(5.943,3.183)--(5.948,3.177)--(5.952,3.172)--(5.956,3.166)%
--(5.960,3.160)--(5.964,3.155)--(5.968,3.149)--(5.972,3.143)--(5.976,3.138)--(5.980,3.132)%
--(5.984,3.127)--(5.988,3.121)--(5.992,3.116)--(5.996,3.110)--(6.000,3.105)--(6.004,3.099)%
--(6.008,3.094)--(6.012,3.088)--(6.016,3.083)--(6.019,3.077)--(6.023,3.072)--(6.027,3.066)%
--(6.031,3.061)--(6.035,3.056)--(6.039,3.050)--(6.043,3.045)--(6.046,3.039)--(6.050,3.034)%
--(6.054,3.029)--(6.058,3.023)--(6.062,3.018)--(6.065,3.013)--(6.069,3.008)--(6.073,3.002)%
--(6.077,2.997)--(6.080,2.992)--(6.084,2.987)--(6.088,2.981)--(6.091,2.976)--(6.095,2.971)%
--(6.099,2.966)--(6.102,2.961)--(6.106,2.956)--(6.110,2.950)--(6.113,2.945)--(6.117,2.940)%
--(6.121,2.935)--(6.124,2.930)--(6.128,2.925)--(6.131,2.920)--(6.135,2.915)--(6.138,2.910)%
--(6.142,2.905)--(6.146,2.900)--(6.149,2.895)--(6.153,2.890)--(6.156,2.885)--(6.160,2.880)%
--(6.163,2.875)--(6.167,2.870)--(6.170,2.865)--(6.174,2.860)--(6.177,2.855)--(6.181,2.850)%
--(6.184,2.845)--(6.187,2.840)--(6.191,2.836)--(6.194,2.831)--(6.198,2.826)--(6.201,2.821)%
--(6.204,2.816)--(6.208,2.811)--(6.211,2.807)--(6.215,2.802)--(6.218,2.797)--(6.221,2.792)%
--(6.225,2.787)--(6.228,2.783)--(6.231,2.778)--(6.235,2.773)--(6.238,2.769)--(6.241,2.764)%
--(6.244,2.759)--(6.248,2.754)--(6.251,2.750)--(6.254,2.745)--(6.258,2.740)--(6.261,2.736)%
--(6.264,2.731)--(6.267,2.726)--(6.270,2.722)--(6.274,2.717)--(6.277,2.713)--(6.280,2.708)%
--(6.283,2.703)--(6.286,2.699)--(6.290,2.694)--(6.293,2.690)--(6.296,2.685)--(6.299,2.681)%
--(6.302,2.676)--(6.305,2.672)--(6.309,2.667)--(6.312,2.663)--(6.315,2.658)--(6.318,2.654)%
--(6.321,2.649)--(6.324,2.645)--(6.327,2.640)--(6.330,2.636)--(6.333,2.631)--(6.336,2.627)%
--(6.340,2.623)--(6.343,2.618)--(6.346,2.614)--(6.349,2.609)--(6.352,2.605)--(6.355,2.601)%
--(6.358,2.596)--(6.361,2.592)--(6.364,2.588)--(6.367,2.583)--(6.370,2.579)--(6.373,2.575)%
--(6.376,2.570)--(6.379,2.566)--(6.382,2.562)--(6.385,2.558)--(6.388,2.553)--(6.391,2.549)%
--(6.393,2.545)--(6.396,2.541)--(6.399,2.536)--(6.402,2.532)--(6.405,2.528)--(6.408,2.524)%
--(6.411,2.519)--(6.414,2.515)--(6.417,2.511)--(6.420,2.507)--(6.423,2.503)--(6.425,2.499)%
--(6.428,2.494)--(6.431,2.490)--(6.434,2.486)--(6.437,2.482)--(6.440,2.478)--(6.442,2.474)%
--(6.445,2.470)--(6.448,2.466)--(6.451,2.462)--(6.454,2.457)--(6.457,2.453)--(6.459,2.449)%
--(6.462,2.445)--(6.465,2.441)--(6.468,2.437)--(6.470,2.433)--(6.473,2.429)--(6.476,2.425)%
--(6.479,2.421)--(6.482,2.417)--(6.484,2.413)--(6.487,2.409)--(6.490,2.405)--(6.492,2.401)%
--(6.495,2.397)--(6.498,2.393)--(6.501,2.389)--(6.503,2.385)--(6.506,2.381)--(6.509,2.377)%
--(6.511,2.374)--(6.514,2.370)--(6.517,2.366)--(6.519,2.362)--(6.522,2.358)--(6.525,2.354)%
--(6.527,2.350)--(6.530,2.346)--(6.533,2.342)--(6.535,2.339)--(6.538,2.335)--(6.541,2.331)%
--(6.543,2.327)--(6.546,2.323)--(6.549,2.319)--(6.551,2.316)--(6.554,2.312)--(6.556,2.308)%
--(6.559,2.304)--(6.562,2.300)--(6.564,2.297)--(6.567,2.293)--(6.569,2.289)--(6.572,2.285)%
--(6.574,2.282)--(6.577,2.278)--(6.580,2.274)--(6.582,2.270)--(6.585,2.267)--(6.587,2.263)%
--(6.590,2.259)--(6.592,2.256)--(6.595,2.252)--(6.597,2.248)--(6.600,2.244)--(6.602,2.241)%
--(6.605,2.237)--(6.607,2.233)--(6.610,2.230)--(6.612,2.226)--(6.615,2.222)--(6.617,2.219)%
--(6.620,2.215)--(6.622,2.212)--(6.625,2.208)--(6.627,2.204)--(6.630,2.201)--(6.632,2.197)%
--(6.635,2.194)--(6.637,2.190)--(6.639,2.186)--(6.642,2.183)--(6.644,2.179)--(6.647,2.176)%
--(6.649,2.172)--(6.652,2.169)--(6.654,2.165)--(6.656,2.161)--(6.659,2.158)--(6.661,2.154)%
--(6.664,2.151)--(6.666,2.147)--(6.668,2.144)--(6.671,2.140)--(6.673,2.137)--(6.676,2.133)%
--(6.678,2.130)--(6.680,2.126)--(6.683,2.123)--(6.685,2.119)--(6.687,2.116)--(6.690,2.112)%
--(6.692,2.109)--(6.694,2.106)--(6.697,2.102)--(6.699,2.099)--(6.701,2.095)--(6.704,2.092)%
--(6.706,2.088)--(6.708,2.085)--(6.711,2.082)--(6.713,2.078)--(6.715,2.075)--(6.718,2.071)%
--(6.720,2.068)--(6.722,2.065)--(6.725,2.061)--(6.727,2.058)--(6.729,2.054)--(6.731,2.051)%
--(6.734,2.048)--(6.736,2.044)--(6.738,2.041)--(6.740,2.038)--(6.743,2.034)--(6.745,2.031)%
--(6.747,2.028)--(6.750,2.024)--(6.752,2.021)--(6.754,2.018)--(6.756,2.015)--(6.758,2.011)%
--(6.761,2.008)--(6.763,2.005)--(6.765,2.001)--(6.767,1.998)--(6.770,1.995)--(6.772,1.992)%
--(6.774,1.988)--(6.776,1.985)--(6.778,1.982)--(6.781,1.979)--(6.783,1.975)--(6.785,1.972)%
--(6.787,1.969)--(6.789,1.966)--(6.792,1.962)--(6.794,1.959)--(6.796,1.956)--(6.798,1.953)%
--(6.800,1.950)--(6.802,1.946)--(6.805,1.943)--(6.807,1.940)--(6.809,1.937)--(6.811,1.934)%
--(6.813,1.931)--(6.815,1.927)--(6.817,1.924)--(6.820,1.921)--(6.822,1.918)--(6.824,1.915)%
--(6.826,1.912)--(6.828,1.908)--(6.830,1.905)--(6.832,1.902)--(6.834,1.899)--(6.836,1.896)%
--(6.839,1.893)--(6.841,1.890)--(6.843,1.887)--(6.845,1.884)--(6.847,1.880)--(6.849,1.877)%
--(6.851,1.874)--(6.853,1.871)--(6.855,1.868)--(6.857,1.865)--(6.859,1.862)--(6.862,1.859)%
--(6.864,1.856)--(6.866,1.853)--(6.868,1.850)--(6.870,1.847)--(6.872,1.844)--(6.874,1.841)%
--(6.876,1.838)--(6.878,1.835)--(6.880,1.832)--(6.882,1.829)--(6.884,1.826)--(6.886,1.823)%
--(6.888,1.820)--(6.890,1.817)--(6.892,1.814)--(6.894,1.811)--(6.896,1.808)--(6.898,1.805)%
--(6.900,1.802)--(6.902,1.799)--(6.904,1.796)--(6.906,1.793)--(6.908,1.790)--(6.910,1.787)%
--(6.912,1.784)--(6.914,1.781)--(6.916,1.778)--(6.918,1.775)--(6.920,1.772)--(6.922,1.769)%
--(6.924,1.766)--(6.926,1.763)--(6.928,1.760)--(6.930,1.757)--(6.932,1.755)--(6.934,1.752)%
--(6.936,1.749)--(6.938,1.746)--(6.940,1.743)--(6.942,1.740)--(6.944,1.737)--(6.946,1.734)%
--(6.948,1.731)--(6.949,1.729)--(6.951,1.726)--(6.953,1.723)--(6.955,1.720)--(6.957,1.717)%
--(6.959,1.714)--(6.961,1.711)--(6.963,1.709)--(6.965,1.706)--(6.967,1.703)--(6.969,1.700)%
--(6.971,1.697)--(6.972,1.694)--(6.974,1.692)--(6.976,1.689)--(6.978,1.686)--(6.980,1.683)%
--(6.982,1.680)--(6.984,1.677)--(6.986,1.675)--(6.988,1.672)--(6.989,1.669)--(6.991,1.666)%
--(6.993,1.663)--(6.995,1.661)--(6.997,1.658)--(6.999,1.655)--(7.001,1.652)--(7.003,1.650)%
--(7.004,1.647)--(7.006,1.644)--(7.008,1.641)--(7.010,1.639)--(7.012,1.636)--(7.014,1.633)%
--(7.015,1.630)--(7.017,1.628)--(7.019,1.625)--(7.021,1.622)--(7.023,1.619)--(7.025,1.617)%
--(7.026,1.614)--(7.028,1.611)--(7.030,1.609)--(7.032,1.606)--(7.034,1.603)--(7.036,1.600)%
--(7.037,1.598)--(7.039,1.595)--(7.041,1.592)--(7.043,1.590)--(7.045,1.587)--(7.046,1.584)%
--(7.048,1.582)--(7.050,1.579)--(7.052,1.576)--(7.054,1.574)--(7.055,1.571)--(7.057,1.568)%
--(7.059,1.566)--(7.061,1.563)--(7.062,1.560)--(7.064,1.558)--(7.066,1.555)--(7.068,1.552)%
--(7.070,1.550)--(7.071,1.547)--(7.073,1.545)--(7.075,1.542)--(7.077,1.539)--(7.078,1.537)%
--(7.080,1.534)--(7.082,1.531)--(7.084,1.529)--(7.085,1.526)--(7.087,1.524)--(7.089,1.521)%
--(7.091,1.518)--(7.092,1.516)--(7.094,1.513)--(7.096,1.511)--(7.098,1.508)--(7.099,1.506)%
--(7.101,1.503)--(7.103,1.500)--(7.104,1.498)--(7.106,1.495)--(7.108,1.493)--(7.110,1.490)%
--(7.111,1.488)--(7.113,1.485)--(7.115,1.482)--(7.116,1.480)--(7.118,1.477)--(7.120,1.475)%
--(7.122,1.472)--(7.123,1.470)--(7.125,1.467)--(7.127,1.465)--(7.128,1.462)--(7.130,1.460)%
--(7.132,1.457)--(7.133,1.455)--(7.135,1.452)--(7.137,1.450)--(7.138,1.447)--(7.140,1.445)%
--(7.142,1.442)--(7.143,1.440)--(7.145,1.437)--(7.147,1.435)--(7.148,1.432)--(7.150,1.430)%
--(7.152,1.427)--(7.153,1.425)--(7.155,1.422)--(7.157,1.420)--(7.158,1.417)--(7.160,1.415)%
--(7.162,1.412)--(7.163,1.410)--(7.165,1.407)--(7.167,1.405)--(7.168,1.403)--(7.170,1.400)%
--(7.172,1.398)--(7.173,1.395)--(7.175,1.393)--(7.176,1.390)--(7.178,1.388)--(7.180,1.385)%
--(7.181,1.383)--(7.183,1.381)--(7.185,1.378)--(7.186,1.376)--(7.188,1.373)--(7.189,1.371)%
--(7.191,1.368)--(7.193,1.366)--(7.194,1.364)--(7.196,1.361)--(7.197,1.359)--(7.199,1.356)%
--(7.201,1.354)--(7.202,1.352)--(7.204,1.349)--(7.205,1.347)--(7.207,1.345)--(7.209,1.342)%
--(7.210,1.340)--(7.212,1.337)--(7.213,1.335)--(7.215,1.333)--(7.217,1.330)--(7.218,1.328)%
--(7.220,1.326)--(7.221,1.323)--(7.223,1.321)--(7.224,1.318)--(7.226,1.316)--(7.228,1.314)%
--(7.229,1.311)--(7.231,1.309)--(7.232,1.307)--(7.234,1.304)--(7.235,1.302)--(7.237,1.300)%
--(7.239,1.297)--(7.240,1.295)--(7.242,1.293)--(7.243,1.290)--(7.245,1.288)--(7.246,1.286)%
--(7.248,1.283)--(7.249,1.281)--(7.251,1.279)--(7.253,1.277)--(7.254,1.274)--(7.256,1.272)%
--(7.257,1.270)--(7.259,1.267)--(7.260,1.265)--(7.262,1.263)--(7.263,1.261)--(7.265,1.258)%
--(7.266,1.256)--(7.268,1.254)--(7.269,1.251)--(7.271,1.249)--(7.272,1.247)--(7.274,1.245)%
--(7.275,1.242)--(7.277,1.240)--(7.278,1.238)--(7.280,1.236)--(7.281,1.233)--(7.283,1.231)%
--(7.284,1.229)--(7.286,1.226)--(7.287,1.224)--(7.289,1.222)--(7.290,1.220)--(7.292,1.218)%
--(7.293,1.215)--(7.295,1.213)--(7.296,1.211)--(7.298,1.209)--(7.299,1.206)--(7.301,1.204)%
--(7.302,1.202)--(7.304,1.200)--(7.305,1.197)--(7.307,1.195)--(7.308,1.193)--(7.310,1.191)%
--(7.311,1.189)--(7.313,1.186)--(7.314,1.184)--(7.316,1.182)--(7.317,1.180)--(7.319,1.178)%
--(7.320,1.175)--(7.322,1.173)--(7.323,1.171)--(7.324,1.169)--(7.326,1.167)--(7.327,1.164)%
--(7.329,1.162)--(7.330,1.160)--(7.332,1.158)--(7.333,1.156)--(7.335,1.154)--(7.336,1.151)%
--(7.338,1.149)--(7.339,1.147)--(7.340,1.145)--(7.342,1.143)--(7.343,1.141)--(7.345,1.138)%
--(7.346,1.136)--(7.348,1.134)--(7.349,1.132)--(7.350,1.130)--(7.352,1.128)--(7.353,1.126)%
--(7.355,1.123)--(7.356,1.121)--(7.358,1.119)--(7.359,1.117)--(7.360,1.115)--(7.362,1.113)%
--(7.363,1.111)--(7.365,1.109)--(7.366,1.106)--(7.368,1.104)--(7.369,1.102)--(7.370,1.100)%
--(7.372,1.098)--(7.373,1.096)--(7.375,1.094)--(7.376,1.092)--(7.377,1.090)--(7.379,1.087)%
--(7.380,1.085)--(7.382,1.083)--(7.383,1.081)--(7.384,1.079)--(7.386,1.077)--(7.387,1.075)%
--(7.389,1.073)--(7.390,1.071)--(7.391,1.069)--(7.393,1.067)--(7.394,1.064)--(7.395,1.062)%
--(7.397,1.060)--(7.398,1.058)--(7.400,1.056)--(7.401,1.054)--(7.402,1.052)--(7.404,1.050)%
--(7.405,1.048)--(7.406,1.046)--(7.408,1.044)--(7.409,1.042)--(7.411,1.040)--(7.412,1.038)%
--(7.413,1.036)--(7.415,1.034)--(7.416,1.031)--(7.417,1.029)--(7.419,1.027)--(7.420,1.025)%
--(7.421,1.023)--(7.423,1.021)--(7.424,1.019)--(7.426,1.017)--(7.427,1.015)--(7.428,1.013)%
--(7.430,1.011)--(7.431,1.009)--(7.432,1.007)--(7.434,1.005)--(7.435,1.003)--(7.436,1.001)%
--(7.438,0.999)--(7.439,0.997)--(7.440,0.995)--(7.442,0.993)--(7.443,0.991)--(7.444,0.989)%
--(7.446,0.987)--(7.447,0.985);
\gpcolor{rgb color={0.000,0.000,0.000}}
\node[gp node right,font={\fontsize{10.0pt}{12.0pt}\selectfont}] at (4.812,1.357) {Asymptotes};
\gpcolor{rgb color={1.000,0.000,1.000}}
\draw[gp path] (1.688,1.357)--(2.604,1.357);
\draw[gp path] (1.320,5.631)--(4.384,5.631);
\draw[gp path] (4.384,5.631)--(7.447,0.985);
\gpcolor{rgb color={0.000,0.000,0.000}}
\gpsetpointsize{8.00}
\gppoint{gp mark 2}{(4.384,5.631)}
\gpdefrectangularnode{gp plot 1}{\pgfpoint{1.320cm}{0.985cm}}{\pgfpoint{7.447cm}{5.631cm}}
\end{tikzpicture}
\end{figure}](img111.png) |
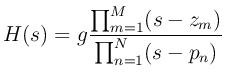
Figure 1 illustrates the Bode plot and its associated
``stick diagram'' (comprised of asymptotic gains) for a single pole at
![]() . We see that the response is flat for low frequencies, drops
to
. We see that the response is flat for low frequencies, drops
to ![]() dB at the break frequency
dB at the break frequency ![]() , and approaches the
, and approaches the ![]() dB per decade asymptote, reaching the asymptote quite well by one
decade above the break frequency at
dB per decade asymptote, reaching the asymptote quite well by one
decade above the break frequency at ![]() .
.
For a general filter transfer function having ![]() poles
poles ![]() and
and ![]() zeros
zeros ![]()
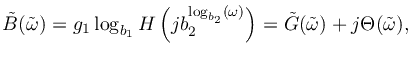
where
where
Our problem is to find poles and zeros of ![]() to minimize some norm of the error
to minimize some norm of the error
![$\displaystyle \left\Vert W({\tilde{\omega}})\left[\tilde{G}'({\tilde{\omega}}) - \alpha \right]\right\Vert
$](img137.png)
where
As a specific example, for the Chebyshev norm and a uniform weighting
![]() between frequencies
between frequencies
![]() and
and
![]() , we have
, we have
![$\displaystyle \min_H\left\{\max_{{\tilde{\omega}}\in[{\tilde{\omega}}_1,{\tilde{\omega}}_2]} \left\vert\tilde{G}'({\tilde{\omega}}) - \alpha \right\vert\right\}.
$](img146.png)
That is, we wish to minimize the worst-case deviation between the desired slope