Next |
Prev |
Up |
Top
|
Index |
JOS Index |
JOS Pubs |
JOS Home |
Search
Modulation by a Complex Sinusoid
Figure:
System diagram for complex demodulation (frequency-shifting) by  .
.
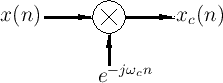 |
Figure 9.12 shows the system diagram for complex
demodulation.10.3The input signal  is multiplied by a
complex sinusoid to produce the frequency-shifted result
is multiplied by a
complex sinusoid to produce the frequency-shifted result
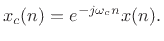 |
(10.8) |
Given a signal expressed as a sum of sinusoids,
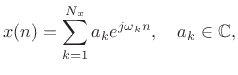 |
(10.9) |
then the demodulation produces
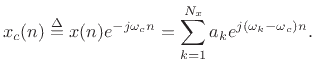 |
(10.10) |
We see that frequency  is down-shifted to
 . In particular, frequency
  (the
``center frequency'') is down-shifted to dc.
(the
``center frequency'') is down-shifted to dc.
Next |
Prev |
Up |
Top
|
Index |
JOS Index |
JOS Pubs |
JOS Home |
Search
[How to cite this work] [Order a printed hardcopy] [Comment on this page via email]