Next |
Prev |
Up |
Top
|
Index |
JOS Index |
JOS Pubs |
JOS Home |
Search
Figure 3.1 shows the signal flow graph (or system
diagram) for the class of digital filters we are considering (digital
comb filters). The symbol `` '' means a delay of
  samples (always an integer here). This notation for a pure delay will
make more sense after we derive the filter transfer function in
§3.7.
samples (always an integer here). This notation for a pure delay will
make more sense after we derive the filter transfer function in
§3.7.
Figure 3.1:
signal flow graph for digital filters
having difference equations of the form
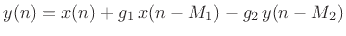 (digital comb filters).
![\includegraphics[width=\twidth]{eps/esd}](img288.png) |
Next |
Prev |
Up |
Top
|
Index |
JOS Index |
JOS Pubs |
JOS Home |
Search
[How to cite this work] [Order a printed hardcopy] [Comment on this page via email]