Next |
Prev |
Up |
Contents |
Top
|
JOS Index |
JOS Pubs |
JOS Home |
Search
Consider a spherical secondary source (``point source'')
located at
 as shown in Fig.15. Then the
pressure amplitude along the listening line
 for all
  is given by
 |
(9) |
where  denotes the pressure amplitude observed from the point
source at
 , and
, and
 denotes the angle of the line from the source center to the line-array
point at
  , i.e.,
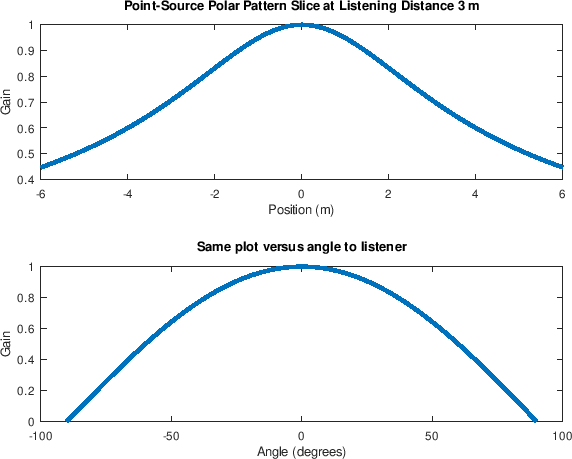
 . This polar-pattern slice is
plotted in Fig.16 for the triangular
array+listener geometry such as described in §4.10 on page
 ![[*]](../icons/crossref.png) , with
, with
 . The top plot shows
  over a 12 m width
centered about a 6 m wide array, and the bottom plot shows
 for
for
![$ \theta\in[-\pi/2,\pi/2]$](img206.png) , thereby covering the
entire axis containing array.
, thereby covering the
entire axis containing array.
Figure 16:
Point-source
polar-pattern slice for a listening-line
 away from the
source. Top: Gain
  versus position
  . Bottom: Gain
  versus angle
 .
.
|
|
In addition to the gain variation  in Eq.(9), we also
have phase effects that we don't have when keeping radius
  constant and only varying
  . The envelope
  in Fig.16 is due only to spherical
spreading loss according to
  . The difference in propagation
distance between
  and
and  is
is
![$\displaystyle r_d(x) \isdef r_l(x)-r_l(0) = r_l(x)-z_l = \sqrt{z_l^2+x^2}-z_l = z_l\left[\sqrt{1+\tan^2(\theta)}-1\right]. \protect$](img208.png) |
(10) |
The resulting frequency-response
re is
plotted in Fig.17 for 1 kHz (wavelength about a
foot (1.126 ft)) and
  , where
 is the wavenumber (spatial radian frequency), which has
made its appearance for the first time in these formulas.34
Figure 17:
Real part of point-source
frequency-response for a listening-line one wavelength away
(
 ). Top: Gain
  versus position
  . Bottom: Gain
 versus angle
 .
.
|
|
For small  , we can use the approximation
Next |
Prev |
Up |
Contents |
Top
|
JOS Index |
JOS Pubs |
JOS Home |
Search
Download huygens.pdf
[Comment on this page via email]
![]() as shown in Fig.15. Then the
pressure amplitude along the listening line
as shown in Fig.15. Then the
pressure amplitude along the listening line
![]() for all
for all ![]() is given by
is given by

![]() in Eq.(9), we also
have phase effects that we don't have when keeping radius
in Eq.(9), we also
have phase effects that we don't have when keeping radius ![]() constant and only varying
constant and only varying ![]() . The envelope
. The envelope ![]() in Fig.16 is due only to spherical
spreading loss according to
in Fig.16 is due only to spherical
spreading loss according to ![]() . The difference in propagation
distance between
. The difference in propagation
distance between ![]() and
and ![]() is
is

![]() , we can use the approximation
, we can use the approximation
