Next |
Prev |
Up |
Top
|
REALSIMPLE Top
Figure 9 shows an overlay
of the original, invfreqz, and stmcb amplitude responses.
Figure 9:
Overlap of the fitted filter magnitude responses and the original signal
|
Figure 10 shows
a close-up of the overlay of the previous figure.
Figure 10:
Closeup of the overlap of the fitted filter magnitude responses and the original signal
|
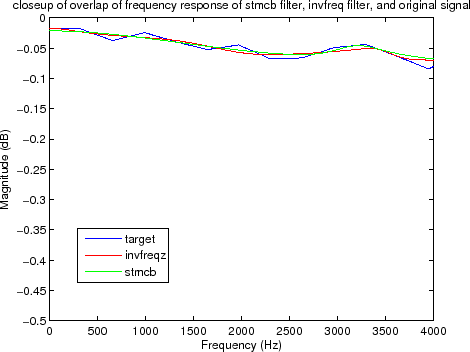
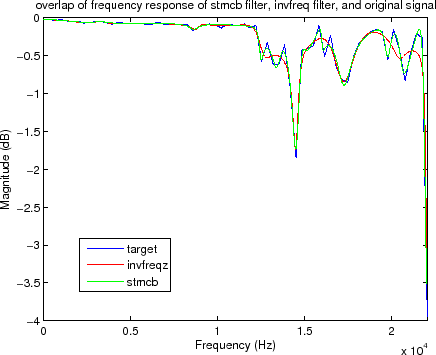
The following code segment was used to generate the above two plots:
figure;
plot(wH*fs/(2*pi),20*log10(abs(Hmin(1:Npt/2+1))));
hold on
plot(Finvf,20*log10(abs(Hinvf)),'r')
plot(Fstm,20*log10(abs(Hstm)),'g')
xlabel('Frequency (Hz)')
ylabel('Magnitude (dB)')
legend('target','invfreqz','stmcb')
title(['closeup of overlap of frequency response of stmcb filter,',...
' invfreq filter, and original signal]');
axis([0 4000 -0.5 0])
Next |
Prev |
Up |
Top
|
REALSIMPLE Top
Download vguitar.pdf