Next  |  Prev  |  Up  |  Top  |  REALSIMPLE Top

Body Resonator

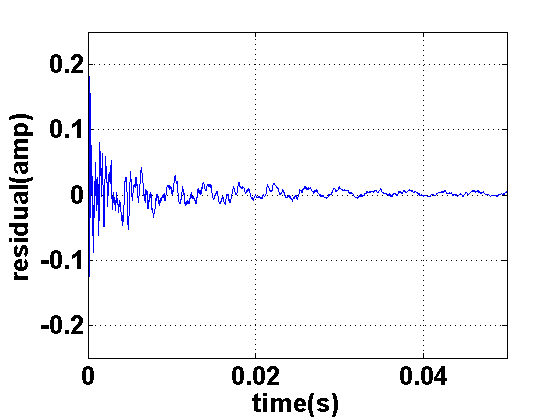
Figure 39: Measured body response from a gypsy guitar. The plot shows the signal from time 0 to $ 50$ ms.
Image body_response_td_closeup

Figure 40: Measured body response from a gypsy guitar. The plot shows the signal from time 0 to $ 1$ s.
Image body_response_td

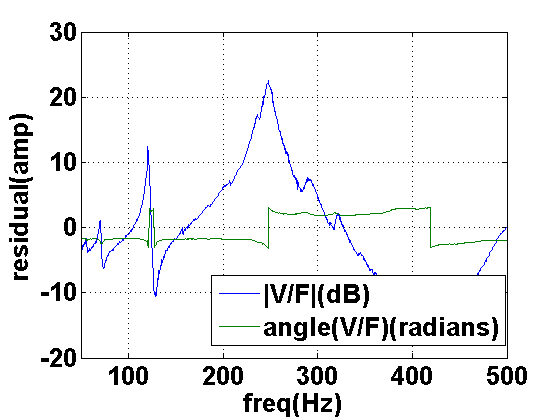
Figure 41: Measured body admittance from a gypsy guitar. The plot shows both the magnitude and phase at frequencies between $ 50$ Hz to $ 500$ Hz.
Image body_response

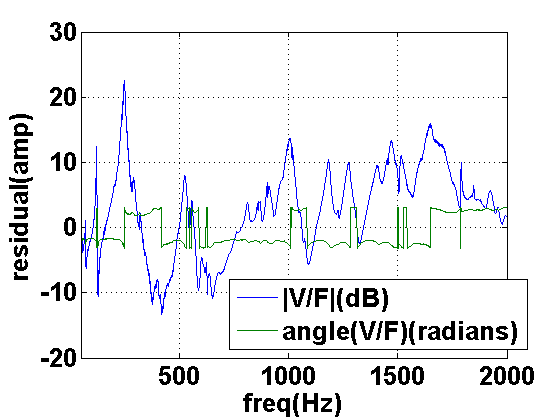
Figure 42: Measured body admittance from a gypsy guitar. The plot shows both the magnitude and phase at frequencies between $ 50$ Hz to $ 2000$ Hz.
Image body_response_zoom_out

From our synthesis model, the body resonator has a driving-point admittance that filters the output of the string model to transform force waves along the string into acceleration waves at the bridge [44]. Taking the inverse-FFT of the measured driving-point admittance, we obtain the impulse response of the body of the instrument. This time-domain signal can be stored as a wavetable for convolution with the output of the synthesis string-model. Figures 394041 and 42 show the time-domain signal and spectrum (both magnitude and phase) of a measured guitar's body impulse response, respectively. As shown, the impulse response lasts well over $ 50$ ms long. Viewing its spectrum in Figure 41, we note peaks that occur near $ 120$ and $ 250$ Hz.


Subsections
Next  |  Prev  |  Up  |  Top  |  REALSIMPLE Top

Download phys_mod_overview.pdf

``Virtual Stringed Instruments'', by Nelson Lee and Julius O. Smith III,
REALSIMPLE Project — work supported by the Wallenberg Global Learning Network .
Released 2008-02-20 under the Creative Commons License (Attribution 2.5), by Nelson Lee and Julius O. Smith III
Center for Computer Research in Music and Acoustics (CCRMA),   Stanford University
CCRMA