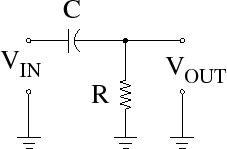
The circuit shown in Figure 7 was measured to show how the sound interface
non-idealities affect a measurement. ![]() was connected to the output of
channel 1 of the PreSonus sound interface, and
was connected to the output of
channel 1 of the PreSonus sound interface, and ![]() was connected to the
line input of channel 1 of the interface.
was connected to the
line input of channel 1 of the interface.
The analog transfer function ![]() can be determined analytically using the voltage divider rule:
can be determined analytically using the voltage divider rule:
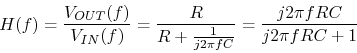 |
(5) |
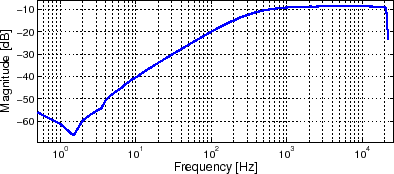
In this case, ![]() k
k![]() and
and ![]() F, so the -3dB point is
about
F, so the -3dB point is
about
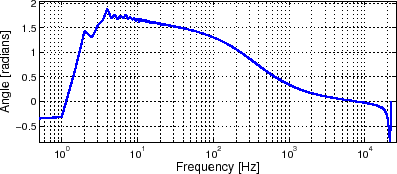
![]() Hz. Figure 8 and
Figure 9 show that the frequency response is accurately measured in the
range of about 10Hz to about
Hz. Figure 8 and
Figure 9 show that the frequency response is accurately measured in the
range of about 10Hz to about ![]() .
.
The ringing in the measured impulse response distracts from the more subtle characteristics of the ideal high pass filter impulse response. For transfer functions that pass large amounts of energy at high frequencies, it may be more instructive to inspect the frequency domain measurement results.