Next |
Prev |
Up |
Top
|
Index |
JOS Index |
JOS Pubs |
JOS Home |
Search
Let's estimate the autocorrelation and power spectral density of the
``moving average'' (MA) process
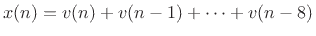 |
(7.34) |
where  is unit-variance white noise.
Since
![$ h = [1,1,1,1,1,1,1,1]$](img1195.png) ,
,
![$\displaystyle h\star h = [8,7,6,5,4,3,2,1,0,\ldots]$](img1196.png) |
(7.35) |
for nonnegative lags ( ). More completely, we can write
![$\displaystyle (h\star h)(l) = \left\{\begin{array}{ll} 8-l, & \vert l\vert<8 \\ [5pt] 0, & \vert l\vert\ge 8. \\ \end{array} \right.$](img1198.png) |
(7.36) |
Thus, the autocorrelation of  is a triangular pulse centered on lag 0.
The true (unbiased) autocorrelation is given by
is a triangular pulse centered on lag 0.
The true (unbiased) autocorrelation is given by
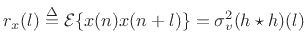 |
(7.37) |
The true power spectral density (PSD) is then
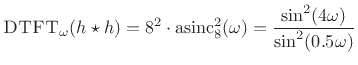 |
(7.38) |
Figure 6.3 shows a collection of measured autocorrelations together
with their associated smoothed-PSD estimates.
Next |
Prev |
Up |
Top
|
Index |
JOS Index |
JOS Pubs |
JOS Home |
Search
[How to cite this work] [Order a printed hardcopy] [Comment on this page via email]
![\includegraphics[width=\twidth]{eps/tcolored}](img1201.png)