 |
 |
 |
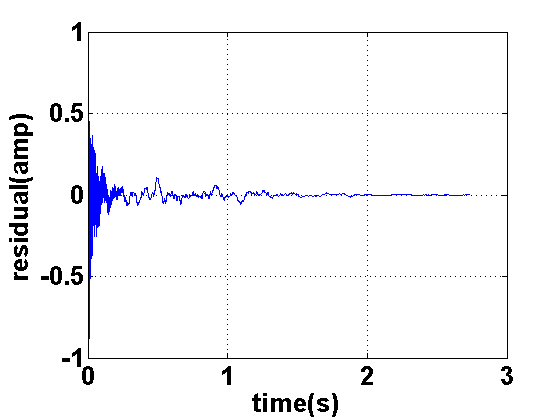
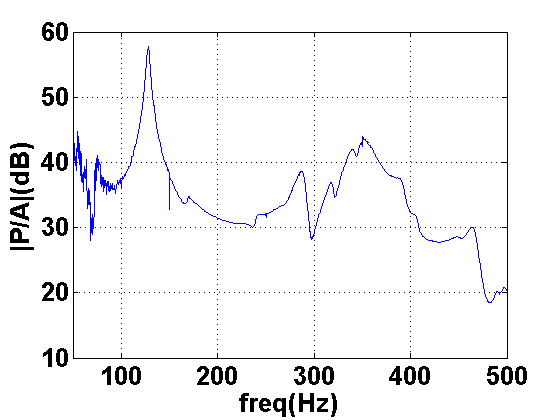
Using the measurements made in Section 3.4, we compute the point-to-point
transfer function from the bridge to a single point in space. The resulting response
is shown in Figure 45. The spectrum of the response is shown in
Figure 46. Observing Figure 45, the length
of the response is close to ![]() s long. Similar to the issues addressed with the body response,
having to store the entire radiation response is costly. Therefore, the methods discussed
for removing spectral peaks for the body response can be directly applied to the radiation
response.
s long. Similar to the issues addressed with the body response,
having to store the entire radiation response is costly. Therefore, the methods discussed
for removing spectral peaks for the body response can be directly applied to the radiation
response.
Similar to how the driving-point admittance is used to model the transfer of energy from the string to the bridge and vice-versa, the transfer function from a point-to-point measurement of acceleration of the top-plate to a point in space of pressure waves is used to affect the final sound output from our physical model.