|
To exeraggerate the nonlinearity of a loudspeaker, we cut the cone of a mishandled driver as shown in Figure 13. We monitored the sound pressure several centimeters in front of the dustcap using an Audio Technica AT4049a microphone, which has a flat magnitude response to within 3dB from 100Hz to 5kHz. The output from channel 1 of the PreSonus sound interface was connected to the speaker via a power amplifier, and the microphone was connected to the microphone input of channel 1 on the sound interface. The following results are typical of sine sweep measurements with a weakly nonlinear motor.
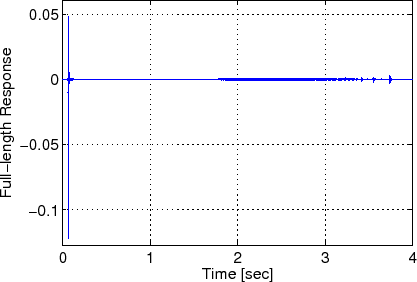
Inverse filtering the measured response results in Figure 14, which is a plot of nonlinear2ImpResp.wav. The linear contribution corresponds to the spike at the beginning, while the weakly nonlinear terms are clustered closer to the end of the response.
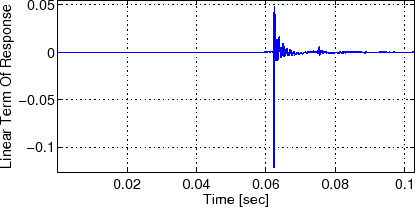
The main linear contribution is cut out and plotted in Figure 15. The measurement was not made in an anechoic chamber, so there is a reflection about 15ms after the main impact.
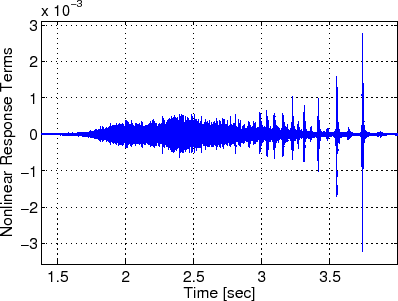
The nonlinear terms are shown magnified in Figure 16. The
lower order nonlinear terms toward the right have larger magnitude but overlap
less in time (see Figure 16).
Note that (8) implies that the overlapping could be reduced
by increasing the total length ![]() of the sweep excitation signal.
of the sweep excitation signal.
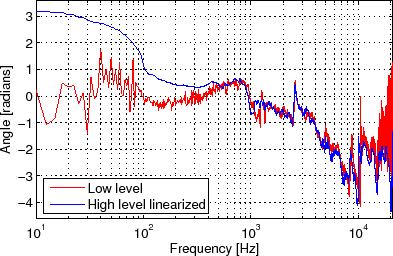
The magnitude and phase responses corresponding to the linear impulse response term from Figure 15 are shown in Figure 17 and Figure 18 in blue. For comparison, another sine sweep measurement was made at a lower level so that the speaker behaved approximately linearly. Decreasing the level also resulted in more noise and even some systematic error, as is evidenced by the red curves in Figure 17 and Figure 18. This comparison demonstrates that making measurements at larger levels can reduce the effects of noise, while nonlinear motor effects can be overcome with the sine sweep measurement technique.