 |
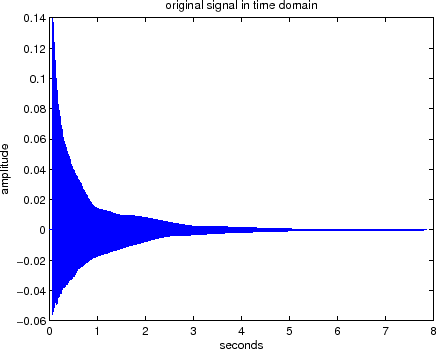
The following code segments shows basic usage of reading a file into Matlab and plotting the data to obtain the results in Figure 1.
fileName = 'hard_long_1_16b.wav';
[y,fs,bits]=wavread(fileName);

%% fs is the sampling rate of the recording
%% here we have fs = 44100
t=(0:length(y)-1)*1/fs;
figure;plot(t,y)
xlabel('seconds');
ylabel('amplitude');
title('original signal in time domain');