Next  |  Prev  |  Up  |  Top  |  REALSIMPLE Top

Other harmonics

In this section we have provided overlays of our linear fits to other harmonics, as well as their extrapolated decays. Note that in many of the plots, there is a two-stage decay. We want to find the gain relative to the slope of the greater initial decay, rather than the second-stage decay.
  1. The 2nd Harmonic

    Figure 16 shows the linear fit and the region used for the 2nd harmonic.

    Figure 16: Linear fit and the region used for the 2nd harmonic
    \resizebox{4.3in}{!}{\includegraphics{\figdir /06-05-22-17-2nd-harm-fit.eps}}

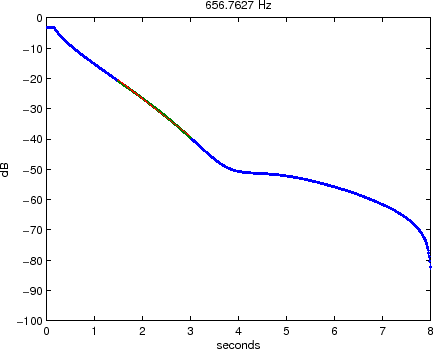
    Figure 17 shows the extrapolated decay for the 2nd harmonic.

    Figure 17: Extrapolated decay for the 2nd harmonic
    \resizebox{4.3in}{!}{\includegraphics{\figdir /06-05-22-18-2nd-harm-extrap.eps}}

  2. The 3rd Harmonic

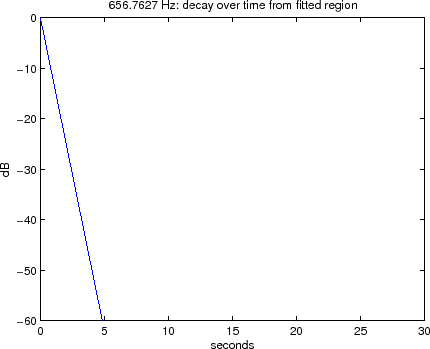
    Figure 18 shows the linear fit and the region used for the 3rd harmonic.

    Figure 18: Linear fit and the region used for the 3rd harmonic
    \resizebox{4.3in}{!}{\includegraphics{\figdir /06-05-22-19-3rd-harm-fit.eps}}

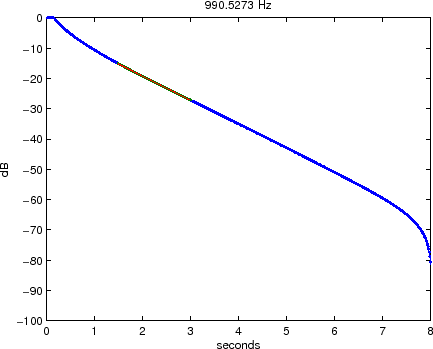
    Figure 19 shows the extrapolated decay for the 3rd harmonic.

    Figure 19: Extrapolated decay for the 3rd harmonic
    \resizebox{4.3in}{!}{\includegraphics{\figdir /06-05-22-20-3rd-harm-extrap.eps}}

  3. At 3628Hz

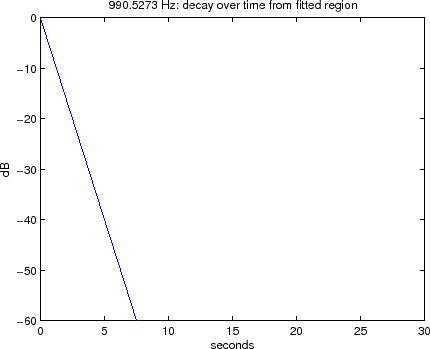
    Figure 20 shows the linear fit and the region used at 3628Hz.

    Figure 20: Linear fit and the region used 3628Hz
    \resizebox{4.3in}{!}{\includegraphics{\figdir /06-05-22-21-3628-harm-fit.eps}}

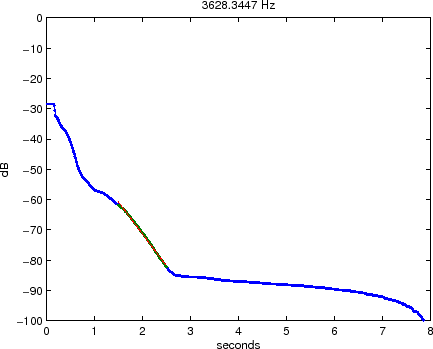
    Figure 21 shows the extrapolated decay at 3628Hz.

    Figure 21: Extrapolated decay at 3628Hz
    \resizebox{4.3in}{!}{\includegraphics{\figdir /06-05-22-22-3628-harm-extrap.eps}}

  4. At 12527Hz

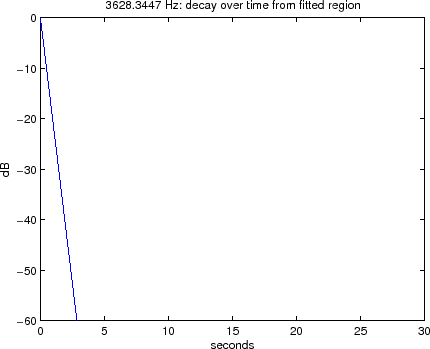
    Figure 22 shows the linear fit and the region used at 12527Hz.

    Figure 22: Linear fit and the region used 12527Hz
    \resizebox{4.3in}{!}{\includegraphics{\figdir /06-05-22-23-12527-harm-fit.eps}}

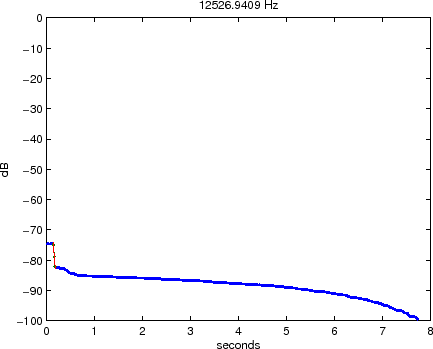
    Figure 23 shows the extrapolated decay at 12527Hz.

    Figure 23: Extrapolated decay at 12527Hz
    \resizebox{4.3in}{!}{\includegraphics{\figdir /06-05-22-24-12527-harm-extrap.eps}}

  5. At 21759Hz

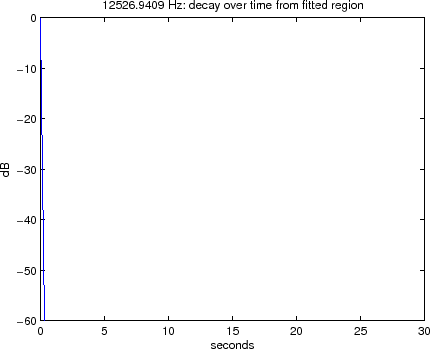
    Figure 24 shows the linear fit and the region used at 21759Hz.

    Figure 24: Linear fit and the region used 21759Hz
    \resizebox{4.3in}{!}{\includegraphics{\figdir /06-05-22-25-21759-harm-fit.eps}}

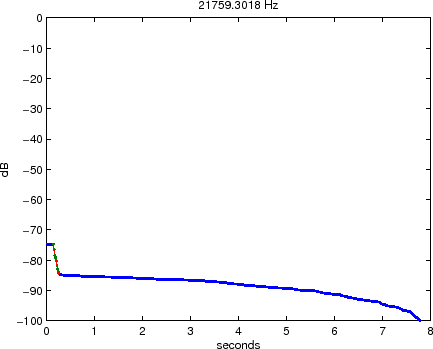
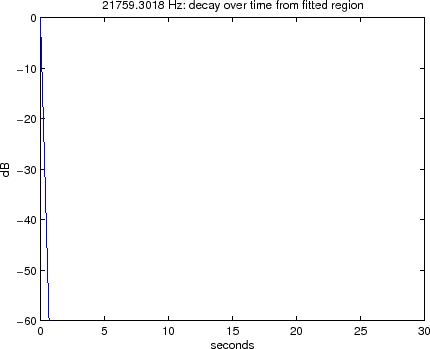
    Figure 25 shows the extrapolated decay at 21759Hz.

    Figure 25: Extrapolated decay at 21759Hz
    \resizebox{4.3in}{!}{\includegraphics{\figdir /06-05-22-26-21759-harm-extrap.eps}}


Next  |  Prev  |  Up  |  Top  |  REALSIMPLE Top

Download vguitar.pdf

``REALSIMPLE Basic Virtual Acoustic Guitar Lab'', by Nelson Lee and Julius O. Smith III,
REALSIMPLE Project — work supported by the Wallenberg Global Learning Network .
Copyright © 2008-06-05, by Nelson Lee and Julius O. Smith III
Center for Computer Research in Music and Acoustics (CCRMA),   Stanford University
CCRMA