Next  |  Prev  |  Up  |  Top  |  REALSIMPLE Top

Creating a Time-Varying Loudness Profile

This section assumes you have just created a cochlear excitogram in Octave as described in Section 4.1.

  1. The first step in creating a time-varying loudness profile from a cochlear excitogram involves creating a specific loudness-gram. You can do this in Octave using the following command:
      > xSpecLoudgram = excitPat2SpecLoud(xExcitogram, bandCentersHz);
    

  2. Second, to compute and plot the instantaneous, short-term, and long-term loudness profiles from the specific loudness-grams, issue the following command:
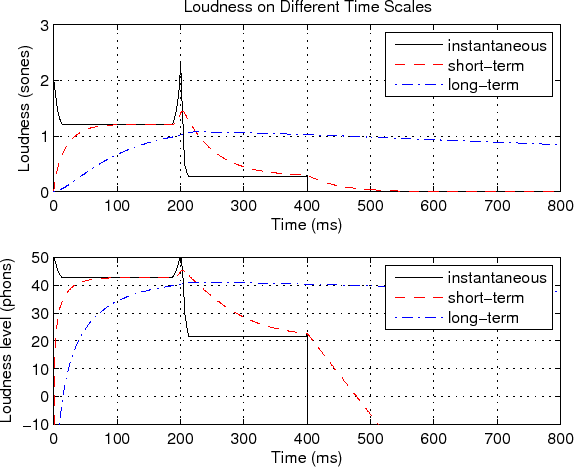
      > specLoud2LoudProf(xSpecLoudgram, bandCentersHz);
    
    A sample loudness profile, plotted in both sones and phons, is shown in Figure 6.

    Figure 6: Sample instantaneous, short-term, and long-term loudness profiles.
    \includegraphics{figures/loud_prof.eps}


Next  |  Prev  |  Up  |  Top  |  REALSIMPLE Top

Download psychoacoustics.pdf

``Psychoacoustics Lab Activity'', by Ryan J. Cassidy and Julius O. Smith III,
REALSIMPLE Project — work supported by the Wallenberg Global Learning Network .
Released 2008-06-05 under the Creative Commons License (Attribution 2.5), by Ryan J. Cassidy and Julius O. Smith III
Center for Computer Research in Music and Acoustics (CCRMA),   Stanford University
CCRMA