 |
> x = loadLoudnessTestSound();This creates a test sound, and stores it in the Octave variable x.
> xFilt = transmissionOuterMidEar(x);
> xSTFT = cochlearInput2fftInt(xFilt);
> [xExcitogram,bandCentersHz] = fftInt2ExcitPat(xSTFT);In this command, the excitogram is stored in the Octave variable xExcitogram, and the variable bandCentersHz gives the frequencies at which the excitogram is computed. This command may require a minute or so to finish on your computer.
You can create a plot of the excitogram using the following:
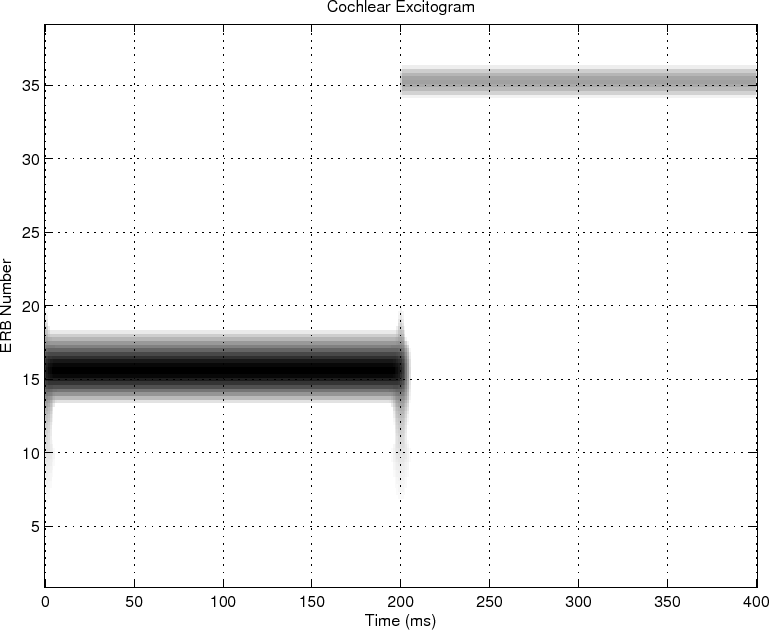
> excitPatPlot(xExcitogram, bandCentersHz);The plot should resemble that shown in Fig.5.
How many sound objects do you see on the excitogram? Approximately what ERB numbers do these sound objects correspond to? What frequencies in Hz do these ERB numbers correspond to? Which sound object creates the largest cochlear excitation? Which creates the smallest cochlear excitation?