Ensure that the waveform is not clipping. Clipping occurs if the amplitude is too large to be recorded properly. This is evidenced by the pluck recording being cut off, clipped, or limited at the boundaries of the waveform display (in this case -1 and 1 on the vertical axis). If clipping is occurring, reduce the input gain (volume) slightly for the sound interface. This can often be accomplished by turning a knob on the sound interface. Sometimes it is necessary to adjust the volume in software with a control panel. Continue after you have ensured that clipping is not occurring.
Does the string sound differently when plucked more forcefully? How would the shape of the plot differ from the shape of the gentle pluck plot?
Record your expectations below:
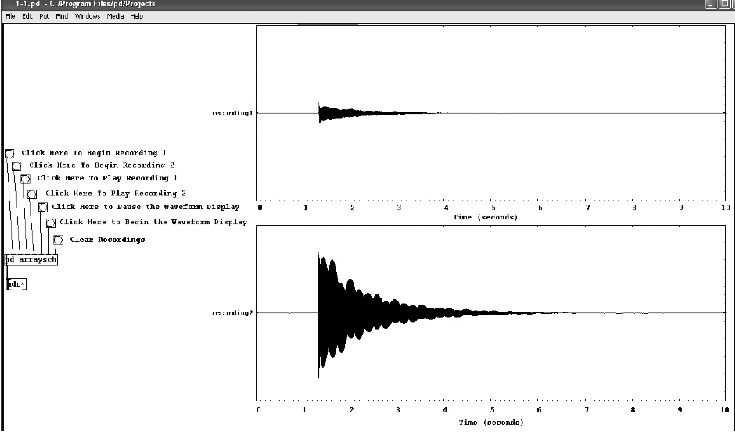
Think about how the string looks when it is vibrating. It is vibrating so fast that you probably cannot track it moving back and forth with your eyes, you merely see a blur. This blurring also affects the waveform display. In 10 seconds, the string vibrates so many times that no visual representation can trace out all of the individual cycles. As a result, the waveform display shows only the outline of the string's vibrations-much like how you can see the edges of the blurring action when you watch the vibrating string with your eye.
You should now have a graphical display of the two waveforms similar to the display in Figure 3. Note the difference in the two recorded waveforms. The recorded samples can be played back by clicking the appropriate ``Click Here to Play Recording'' button. Do they differ in any ways besides volume?
In a moment, you will determine the time constants for your recordings.
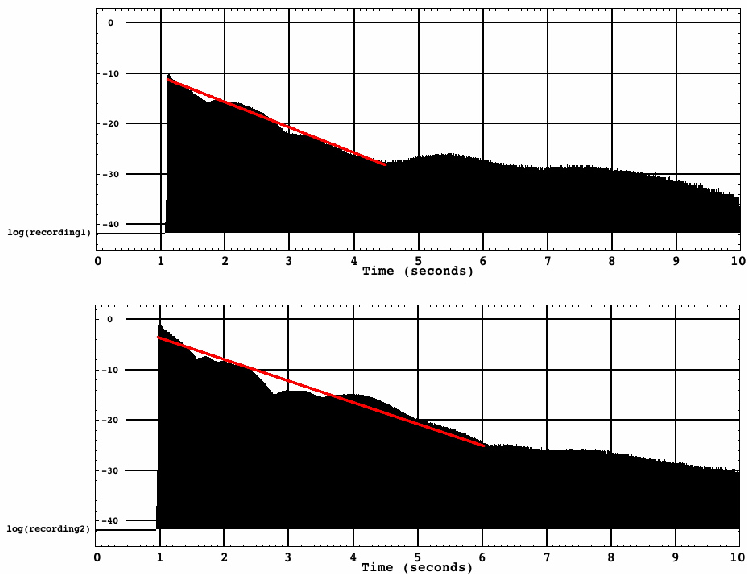
Scroll down to the bottom of the Pd patch window. You should see two plots called
log(recording1) and log(recording2). They correspond to
![]() for the gentle and hard string plucks, respectively. Note that they do not make out
perfect lines. However, they should be comparable to Figure 4, where the red lines
indicate the way that a line may be fit approximately to the beginnings of the plucks.
The time constants for these recordings are about 0.8sec and 1sec.
for the gentle and hard string plucks, respectively. Note that they do not make out
perfect lines. However, they should be comparable to Figure 4, where the red lines
indicate the way that a line may be fit approximately to the beginnings of the plucks.
The time constants for these recordings are about 0.8sec and 1sec.
Now calculate the time constants for your recordings. If you wish to check your method, you may use the given time constants for Figure 4. How do your time constants compare? How should they compare?
Record your answers below: