Next |
Prev |
Top
|
Index |
JOS Index |
JOS Pubs |
JOS Home |
Search
Acoustic pulse reflectometry techniques [6] were applied to
obtain the impulse response of a trumpet (without mouthpiece). A
piecewise cylindrical section model of the bore profile was
reconstructed using an inverse-scattering method
[1], taking
into account the viscothermal losses (see Fig. 4).
The piecewise cylindrical model corresponds well to the
physical bore profile for non-flaring tube-segments, thus
giving a good physical model up to the bell.
The remaining cylindrical sections do not provide
valid geometrical information, but they retain all
relevant acoustical information of the bell reflectance,
including the complex effects of higher transversal modes
and radiation impedance.
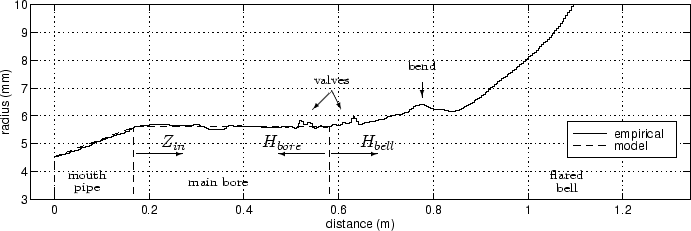
Figure 3:
Trumpet bore profile reconstruction.
The valves and the final tubular bend show as `dents' in the profile.
The main bore plus mouthpipe can be modeled with
a cylindrical section preceded by a truncated cone (dashed lines).
|
|
The main bore of a trumpet is essentially cylindrical, with an initial
taper widening (mouthpipe) (see Fig. 3). Thus,
an accurate digital waveguide model of the trumpet can be derived by
approximating the bore profile data with a cylindrical bore, plus
a conical section to model the mouthpipe, and modeling the
remaining part of the reconstruction as the isolated bell reflectance
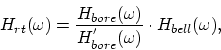
 . The complexity of the model can be further reduced by
lumping the viscothermal losses of the main bore with the bell
reflectance filter, yielding the
``round-trip filter''
. The complexity of the model can be further reduced by
lumping the viscothermal losses of the main bore with the bell
reflectance filter, yielding the
``round-trip filter''
 :
:
 |
(2) |
where
 represents the response ``seen'' from the
bell (see Fig. 3) while assuming an ideal closed
end at the junction between the mouthpiepe and the main bore, and
represents the response ``seen'' from the
bell (see Fig. 3) while assuming an ideal closed
end at the junction between the mouthpiepe and the main bore, and
 is the theoretical
value of
assuming no losses.
The inverse Fourier transform
is the theoretical
value of
assuming no losses.
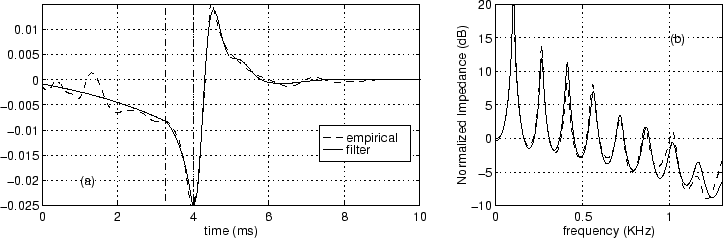
The inverse Fourier transform  differs from the theoretical
Bessel horn response primarily in its two-stage build-up towards the
primary reflection peak (see Fig. 4). This
characteristic was observed for a variety of brass
instruments. By adding another offset-exponential TIIR section
(Eq. (1)) to the basic horn filter structure, the filter design methodology is sufficiently flexible to cover the two-stage build-up.
The resulting impulse response and corresponding input impedance curve
differs from the theoretical
Bessel horn response primarily in its two-stage build-up towards the
primary reflection peak (see Fig. 4). This
characteristic was observed for a variety of brass
instruments. By adding another offset-exponential TIIR section
(Eq. (1)) to the basic horn filter structure, the filter design methodology is sufficiently flexible to cover the two-stage build-up.
The resulting impulse response and corresponding input impedance curve
 (``seen'' from the start of the main bore) are depicted in
Fig. 4. The small amplitude deviations are mainly
due to the fact that the TIIR approximation of the initial slow rise
is insensitive to reflections caused by bore profile dents. Note that the
resonance frequencies, controlled by the phase delay of
are accurately modeled.
(``seen'' from the start of the main bore) are depicted in
Fig. 4. The small amplitude deviations are mainly
due to the fact that the TIIR approximation of the initial slow rise
is insensitive to reflections caused by bore profile dents. Note that the
resonance frequencies, controlled by the phase delay of
are accurately modeled.
Figure 4:
Round-trip filter (a) and ``main-bore'' input impedance (b)
according to empirical data (dashed) compared to TIIR horn filter
(solid). The vertical (dash-dot) lines in (a) indicate the response
segmentation into 2 growing exponentials and a tail. The tail is
modeled with a 4th-order IIR filter.
|
|
Next |
Prev |
Top
|
Index |
JOS Index |
JOS Pubs |
JOS Home |
Search
Download tiirts.pdf
Visit the book (DRAFT) containing this material.