Sound Visualization with OpenGL
Music 256a Homework 3
In this assignment real-time streaming audio was visualized in various ways. The RtAudio library was used for handling real-time audio input and output. The project's source files include the necessary files from this library as well as:
Definitions:
defs.h
Makefiles:
makefile
makefile.linux
makefile.osx
Classes:
FftBase.h
FftBase.cpp
WindowedFftHandler.h
WindowedFftHandler.cpp
AutocorrHandler.h
AutocorrHandler.cpp
ChannelBuffersHandler.h
ChannelBuffersHandler.cpp
LineDisplayHandler2D.h
LineDisplayHandler2D.cpp
WaveformDisplay.h
WaveformDisplay.cpp
SpectrumDisplay.h
SpectrumDisplay.cpp
AutocorrDisplay.h
AutocorrDisplay.cpp
Main Program:
TimeframeVisualizer.cpp
In order to build the project, download the zipped source folder. Makefiles are provided to compile the code for either Mac OS X or Linux by specifying the correct makefile to use. Typing 'make' at a command line in the source directory will output the correct syntax for specifying which of these makefiles to use.


In constructing these classes I also implemented my own FFT process, taking the main FFT algorithm loop from the processing minim library, so that I could use doubles to store my samples (and to gain some more experience staring at FFT code - I find this FFT function is much more readable and understandable than the provided chuck_fft.c FFT code was, although that code is slightly more efficient).
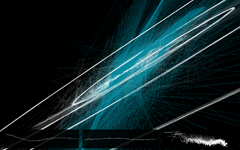
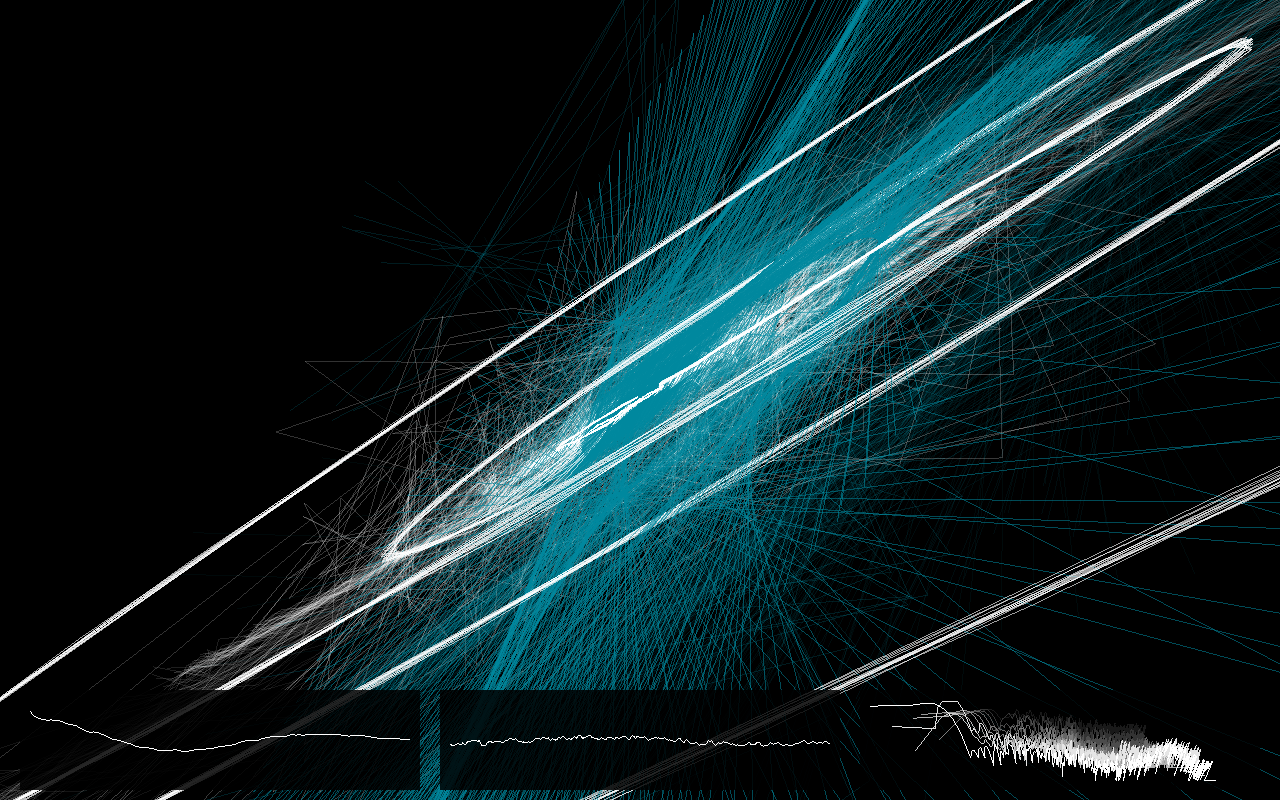
The main visualization in this program is an autocorrelation based visualization which simply uses values from the autocorrelation of the sound to generate the vertices of line segments. It seems to provide an oddly expressive visualization of timbre - strong sinusoidal components result in ellipses and spirals while transients and noise bursts result in sharp, spiked shapes.
I also experimented with multiple viewports and frames of reference for the OpenGL rendering (as seen in the waveform display windows which can be toggled in 3D mode), including a 3D perspective within a 2D ortho window (the waterfall plot). This seems like it could provide a very useful way of positioning and rendering various windows in a flexible way, allowing the contents to be rendered relative to a specified viewport and scaling.
Definitions:
defs.h
Makefiles:
makefile
makefile.linux
makefile.osx
Classes:
FftBase.h
FftBase.cpp
WindowedFftHandler.h
WindowedFftHandler.cpp
AutocorrHandler.h
AutocorrHandler.cpp
ChannelBuffersHandler.h
ChannelBuffersHandler.cpp
LineDisplayHandler2D.h
LineDisplayHandler2D.cpp
WaveformDisplay.h
WaveformDisplay.cpp
SpectrumDisplay.h
SpectrumDisplay.cpp
AutocorrDisplay.h
AutocorrDisplay.cpp
Main Program:
TimeframeVisualizer.cpp
Screenshots:


Comments:
In designing this program, I explored various ways of structuring computation and display units in order to gain experience on how these two parts of a real-time audio program might be connected in a medium scale project. In the end I settled on a series of "Handler" classes, each of which perform some function (either computation or display formatting) which were then combined into "Display" classes (connecting the computation units needed for some display with the type of display formatting needed). Splitting up the functionality in this way was somewhat overkill for the homework assignment itself, but provided some good learning and experience as well as code which may be reusable for the final project. The three display windows which can be toggled in 3D mode display (from left to right) the signal's autocorrelation, waveform, and spectrum.In constructing these classes I also implemented my own FFT process, taking the main FFT algorithm loop from the processing minim library, so that I could use doubles to store my samples (and to gain some more experience staring at FFT code - I find this FFT function is much more readable and understandable than the provided chuck_fft.c FFT code was, although that code is slightly more efficient).
The main visualization in this program is an autocorrelation based visualization which simply uses values from the autocorrelation of the sound to generate the vertices of line segments. It seems to provide an oddly expressive visualization of timbre - strong sinusoidal components result in ellipses and spirals while transients and noise bursts result in sharp, spiked shapes.
I also experimented with multiple viewports and frames of reference for the OpenGL rendering (as seen in the waveform display windows which can be toggled in 3D mode), including a 3D perspective within a 2D ortho window (the waterfall plot). This seems like it could provide a very useful way of positioning and rendering various windows in a flexible way, allowing the contents to be rendered relative to a specified viewport and scaling.
Back to 256a main page