« SoVND »
Sonifying & Visualizing Neural Data
Mindy Chang
Idea / Premise
Our brains are able to manage a great deal of information, from taking in sensory perceptions to forming decisions and transforming plans to actions. Somehow this is achieved by a network of billions of interconnected neurons, which communicate with each other by sending electrical pulses called action potentials. In the lab, we can record the activity of single neurons through electrodes placed in the brain while subjects (in our case monkeys) are performing specific tasks. Neural responses are often very diverse, and when trying to understand how a population of neurons might work together, simply averaging across all neurons results in a loss of information, while plotting the raw responses of all neurons can quickly become overwhelming to interpret.
VisionUltimately, the program should provide the user with an integrated audio and visual experience, seeing the stimulus display that the monkey sees as well as visualizing and listening to the simultaneous responses of multiple neurons. The user should have the flexibility to choose how to map the sound in order to make the features they’re listening for more salient. There are a number of data parameters that can be mapped onto different features of sound and visualization: 
Product
The current implementation provides a way to explore data offline (i.e. after the data has been collected). The user can load different combinations of single trials, average trials, or average difference trials for a particular task. The rasters are labeled and stacked as blocks on the left side of the screen. Within a raster, each row represents one neuron. For single trials, each dot represents a spike, and for the average and difference plots, spike rate is indicated by the color of the heat map. The average spike rate across all neurons is shown below the raster blocks and highlighted for the current raster. 
ExamplesBackgroundVisual attention plays a crucial role in how we experience the world. Even though it may seem like we can see everything around us, only a limited amount of information is actually selected for detailed processing. Since we have the highest visual acuity at the center of gaze, our eyes are constantly scanning to bring different visual information into focus. We can also attend to peripheral locations while keeping our eyes fixed, for example when keeping an eye on the road but monitoring the surroundings while driving. In the brain, a hypothesis is that maybe the same mechanisms that are used for controlling eye movements are also used for allocating attention. Covert Spatial Attention Task
Monkeys were trained to direct and sustain attention at a peripheral location without the use of eye movements. The monkey must maintain fixation at the center of the screen and use a lever to indicate whether 1 grating embedded among 5 distractors changes orientation across 2 flashes. A spatial cue is given early in the trial, and in order to detect the grating change, the monkey needs to direct attention to the cued location.
Sensory-guided decision making and motor preparation task
In this task, the monkey is shown 2 targets in the periphery, and a random dot pattern appears in the center of the screen for 800 ms. The monkey must determine whether the dots are generally moving towards one target or the other and then shift its eyes to that target later in the trial. On different trials, the strength of the motion signal towards one target or the other is varied from 0 to 40%. Once the fixation spot turns off, the monkey can move its eyes to the chosen target. Neurons were recorded from an area of the brain near or overlapping with the FEF. Below, trials are grouped according to the motion signal strength and the monkey's target choice. The greater the motion coherence of dots, the more information the monkey (and neurons) has for deciding on and planning the upcoming eye movement.
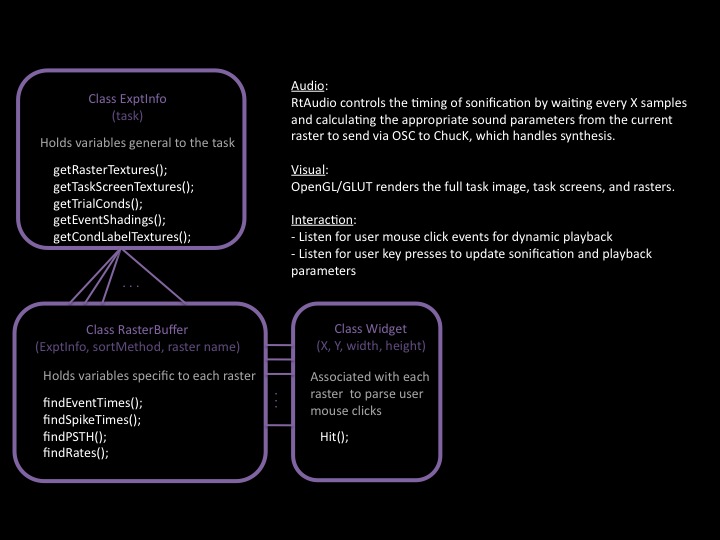
System DesignThe system enables the user to load neural spike train data along with information about the trial and then be able to interact with a graphical interface to choose how to sonify and visualize the data. The software processes the data and then maps different features of the processed to data to sound and visualization parameters. Some considerations to take into account when processing the data include whether/how to window the discrete time series of spikes, whether to normalize the firing rates of different neurons, and whether to assign groupings/categories to different types of neurons. The graphical display is rendered using OpenGL/GLUT; sound is synthesized using ChucK with timing controlled by RtAudio. 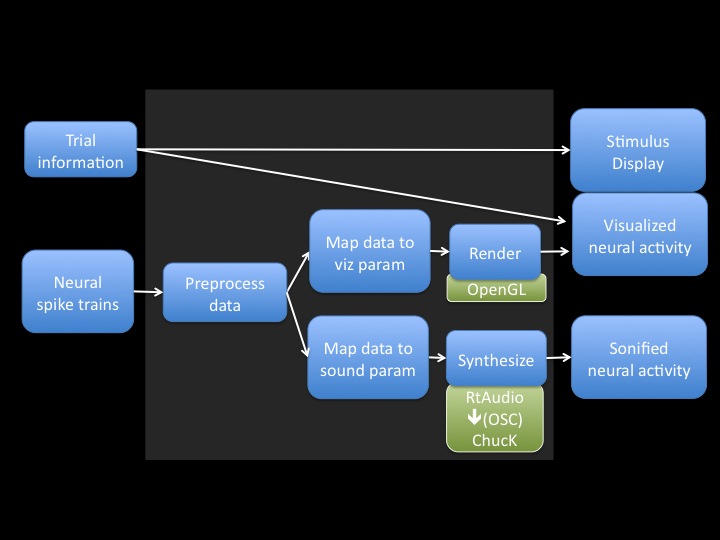

Milestones
1. create a sample data set from existing data; prototype potential sound schemes in Matlab/Chuck
|
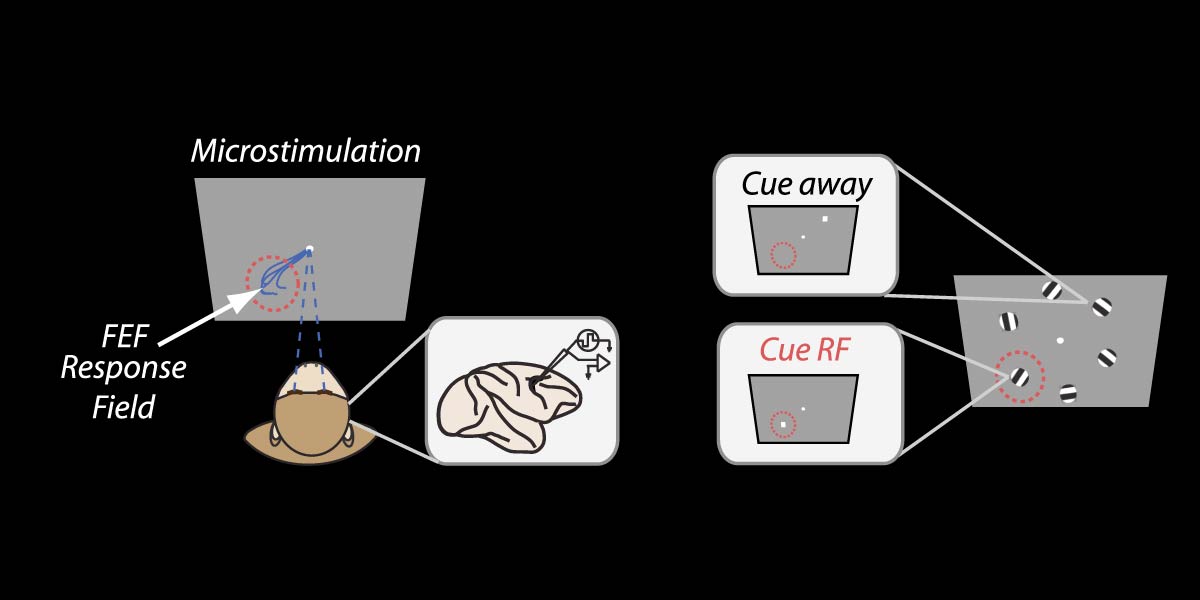 We recorded from neurons in the frontal eye field (FEF), which is an oculomotor area known to play a role in controlling eye movements. The FEF contains a spectrum of visual to (eye) movement responsive cells, which form a map of visual space. For a given neuron, the particular region of space that it is interested in is called its response field (RF). We can find the RF's of individual neurons by electrically stimulating at the recording site, which causes the monkeys to make a stereotyped eye movement (saccade) towards one part of visual space. We are interested in the neural responses when the monkey is attending to the RF of the recorded neurons as compared to when the monkey is attending elsewhere. Within this task, individual neurons show vastly different response profiles even though the monkey does not make any eye movements. As a population, the spike rates of these neurons encode whether the monkey is paying attention to a particular area in visual space throughout the duration of each trial. Here, the neurons are grouped so that their RFs are in the lower left corner of the screen.