Researchers in psychoacoustics have long looked to cochlear models to explain the perception of musical pitch [Small70]. Many experiments have made it clear that the auditory system has more than one mechanism for pitch estimation. In one of these experiments, Flanagan and Guttman used short-duration impulse trains to investigate two different mechanisms for matching periodic sounds, one based on spectrum and one based on pulse rate [Flanagan60]. They used two different impulse trains, one having one pulse per period of the fundamental, the other having four pulses per period, every fourth pulse being negative . These signals have the interesting property that they have the same power spectrum, which seems to suggest that they should have the same pitch. The standard conclusion, however, was that below 150 pulses per second the trains "matched" if they had the same pulse rate; they "matched" on spectrum only when the fundamental frequency was above about 200 Hz.
[Pierce89] modified this experiment by replacing the pulses by tone burstsóshort periods of a 4,800-Hz sine wave modulated by a raised-cosine Hamming window. In essence, he used Flanagan and Guttman's pulses to amplitude modulate a steady high-frequency carrier. His purpose in doing this was to narrow the spectrum, keeping the large response of the basilar membrane near one place (the 4,800-Hz place), regardless of pulse rate.
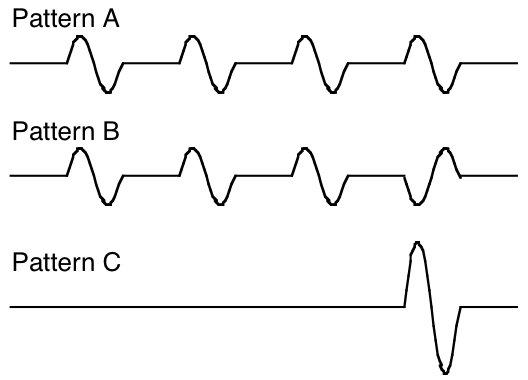
To be more specific, Pierce used the three signal "patterns" shown below. All have the same burst duration, which is one-eighth of a pattern period. Pattern a has four bursts in a pattern period. Pattern b has the same burst rate or pulse rate, but every fourth burst is inverted in phase. Thus, the fundamental frequency of b is a factor of four or two octaves lower than that of a. Pattern c has only one burst per pattern period, and thus has the same period as b; in fact, it can be shown that b and c have the same power spectrum. Thus, a and b sound alike at low pulse rates where pulse-rate is dominant, and b and c sound alike at high pulse rates where spectrum is dominant. Pierce observed that the ear matches a and b for pattern frequencies below 75 Hz, and matches b and c for pattern frequencies above 300 Hz. He found the interval between 75 and 300 Hz to be ambiguous, the b pattern being described as sounding inharmonic.
Pierce's tone bursts. Patterns a and b have the same pulse rate frequency, while b and c have the same power spectrum. Here the test sounds are shown with one cycle per burst.
To see if and how these results are reflected in correlograms, a similar set of tone burst signals were generated. The only difference between our signals and Pierce's signals was due to differences in the digital sampling rate used. To get a Fourier spectrum with minimum spectral splatter, Pierce imposed two requirements:
Thus, to obtain the same spectral characteristics, we had to use different numerical values for the tone-burst frequency fb and the corresponding pattern period T. The table shown below is our version of Table I in Pierce's paper.
| Group # Pattern | Pattern Frequency 1/T | Fundamental Frequency (Hz) | Bursts per Second | Cycles per Burst (n) | Pattern Period T(msec) |
|---|---|---|---|---|---|
| 1a | 3.90625 | 15.625 | 15.625 | 128 | 256 |
| b | 3.90625 | 3.90625 | 15.625 | 128 | 256 |
| c | 3.90625 | 3.90625 | 3.90625 | 128 | 256 |
| 2a | 7.8125 | 31.25 | 31.25 | 64 | 128 |
| b | 7.8125 | 7.8125 | 31.25 | 64 | 128 |
| c | 7.8125 | 7.8125 | 7.8125 | 64 | 128 |
| 3a | 15.625 | 62.5 | 62.5 | 32 | 64 |
| b | 15.625 | 15.625 | 62.5 | 32 | 64 |
| c | 15.625 | 15.625 | 15.625 | 32 | 64 |
| 4a | 31.25 | 125 | 125 | 16 | 32 |
| b | 31.25 | 31.25 | 125 | 16 | 32 |
| c | 31.25 | 31.25 | 31.25 | 16 | 32 |
| 5a | 62.5 | 250 | 250 | 8 | 16 |
| b | 62.5 | 62.5 | 250 | 8 | 16 |
| c | 62.5 | 62.5 | 62.5 | 8 | 16 |
| 6a | 125 | 500 | 500 | 4 | 8 |
| b | 125 | 125 | 500 | 4 | 8 |
| c | 125 | 125 | 125 | 4 | 8 |
| 7a | 250 | 1000 | 1000 | 2 | 4 |
| b | 250 | 250 | 1000 | 2 | 4 |
| c | 250 | 250 | 250 | 2 | 4 |
| 8a | 500 | 2000 | 2000 | 1 | 2 |
| b | 500 | 500 | 2000 | 1 | 2 |
| c | 500 | 500 | 500 | 1 | 2 |
A set of eight test signals was generated according to this scheme. Each test signal consists of a sequence of the a, b and c patterns, each pattern lasting 1.024 seconds. This time interval was chosen to get an exact integer number of bursts, ranging from 4 for Case 1c to 2000 for Cases 8a and 8b.
The following sounds are presented in this video clip:
| 1) | Pattern 1a |
| 2) | Pattern 8a (one cycle per burst) |
| 3) | Pattern 8b (one cycle per burst, every fourth pulse inverted) |
| 4) | Pattern 8c (one cycle per burst, 1/4 spacing of 8a) |
| 5) | Group Pattern 8 (1 cycle/burst) |
| 6) | Group Pattern 7 (2 cycles/burst) |
| 7) | Group Pattern 6 (4 cycles/burst) |
| 8) | Group Pattern 5 (8 cycles/burst) |
| 9) | Group Pattern 4 (16 cycles/burst) |
| 10) | Group Pattern 3 (32 cycles/burst) |
| 11) | Group Pattern 2 (64 cycles/burst) |
| 12) | Group Pattern 1 (128 cycles/burst) |
Our conclusions (both auditory and visual) were very similar to those that Pierce reports, though the ranges were a bit different. We found very clear matching on pulse rate (a and b) for pattern frequencies of 62.5 Hz or less, and very clear matching on fundamental frequency (b and c) for pattern frequencies of 250 Hz or more. The 125-Hz case was ambiguous, but could certainly have been called a pulse-rate match. The following table summarizes our admittedly subjective impressions.
| Cycles/burst n | Pattern freq 1/T | Matching Patterns | Comments |
|---|---|---|---|
| 128 | 3.90625 | a b | a & b sound identical,"pulsy"; c much slower, same "tone" as a, b |
| 64 | 7.8125 | a b | a & b almost identical, "chopped"; c "pulsy," same "tone" as a, b |
| 32 | 15.625 | a b | a & b very close, diff tone color; c "pulsy," "tone" resembles a, b |
| 16 | 31.25 | a b | a & b close, harsh sounding; c "pulsy," "tone" uncertain |
| 8 | 62.5 | a b | a & b related, b more inharmonic; c much lower in pitch, buzzy |
| 4 | 125. | a~b | a & b related, a a bit higher pitch; c lower in pitch, buzzy |
| 2 | 250. | b c | b & c very close, c buzzier; a two octaves higher in pitch |
| 1 | 500. | b c | b & c identical |
These tone-burst signals were processed by the cochlear model, and their correlograms were compared. While interpretation of the images is at least as subjective as interpretation of the sounds, there seemed to be a remarkable correspondence between the appearance of the correlograms and the results shown above.
For high pattern frequencies, the b and c correlograms were very similar, their common fundamental frequencies being clearly evident; they differed primarily in the c pattern having a cleaner high-frequency spectrum. This is roughly in accord with the fact that b and c have the same power spectrum. At the "critical" 125-Hz pattern frequency, the correlograms for b suddenly resembles a much more than c, a resemblance which becomes complete at the lower pattern frequencies. In none of these cases does one see much energy at the low fundamental frequencies, and the higher-frequency time structure of b dominates the match.
|
Frequency
|
||
|
|
||
| Time Delay |