220A Final
Project
CCRMA,
Department of Music, Stanford University
Outline
1. Analyze husky voice and
normal voice using Praat.
2. Extract 12-dimentional chromagram from the husky voice samples and normal voice
samples using matlab.
3. Training SOM(Self Organizing Map)
with the extracted chromagram.
Motivation
Several years ago, I read an
article about the relationship between tone-deaf and his/her parents' voice.
They said that if one of his/her parents has husky voice, he/she turns easily
tone-deaf. So I tried to compare husky voice to normal voice.
Using tools
1. Praat, phonetics tools that can
speech analysis, synthesis and manipulation.
2. matlab
3. ESOM(Emergent Self
Organizing Maps)
What I did
The first task was to analyze normal
voice and husky voice using Praat. From the two
voices, I selected a short part (Ah- sound) which showed stable pitch D. The
spectrograms of the two voices are listed below.


<spectrogram of normal voice> <spectrogram of husky voice>
As you see, whereas normal voice shows
harmonics, husky voice shows a kind of randomness in frequency domain. This
phenomenon is called diplophonia which is a condition whereby the vocal cords
produce more than one note at the same time.
Secondly,
I obtained chromagram of the voice. It was done by matlab coding. To detect chroma
pitch, I used Fujishima' s Pitch Class Profile(PCP) algorithm. For example, in C3 sound, there
exists the harmonics of C3.

In
this example, there are four C keys – C3, C4, C5, C6.
PCP sums these 4 keys intensity. In this way, with a sound source, PCP
calculates the intensity of 12 chromas from C to B.
It is called chromagram. I think that the chromagram of husky voice should be different from normal
voice. When I put the voice files to matlab PCP
program, it was able to get these results.


<chromagram of D key Ah-sound
(normal)> <chromagram of D key Ah-sound (husky)>
These
charts show the difference between normal voice and husky voice. The normal
voice shows harmonic relationship; key A is the 3rd harmonics of key
D, so there is a peak at A in the chromagram.
However, in the chromagram of husky voice, we cannot
find this relationship because of diplophonia; the
intensity is quite flat except the original key D.
Thirdly,
I trained ESOM by these chromagram from C to B.


<Normal voice> <Husky
voice>
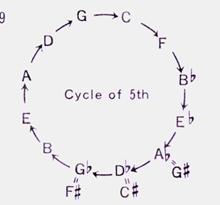
Before
the experimental, I expected that I could see the perfect circle of 5th
with the normal voice. But the result was somewhat different. As you see below,
there are two-circle of 5th.
With
the husky voice, you cannot see circle of 5th. With these results, I
cannot find any relevance between husky voice and tone-deaf. However, I think
this result can be a starting point and I am going to study more about this
subject.
Sound samples that I used
Ah- sound clip from husky voice
Ah- sound clip from
normal voice
Matlab
files for Pitch Class Profile