> HCI
• muggling
• the plank
• the box
> Timbral Analysis
• formant analysis
• orchestration
> Music Cognition
> Music Synthesis
Formant Analysis
Most acoustic
instruments produce prominent formant frequencies. Formants are
resonances that are characteristic of a sound. Phonemes can be
characterized by 3 prominent formants or frequency regions. A
particular set of formant frequencies characterize each vowel and are
relatively independent of a voices pitch. Female and male voices
obviously have different formant frequency ranges, however the ratio
between formant frequencies is consistent across males, females,
adults, and children. The following analysis will show how acoustic
instrumental sounds can be analyzed to determine their formant
frequency or frequencies. This is used to place each instrument
within a "formant space" mapping instrumental timbre to vowels.
The soundfile of the cardinal vowels was analyzed
to create the following spectrogram.

The dark bands denote the formant frequencies. These results were used to plot each vowel on the vowel formant chart.
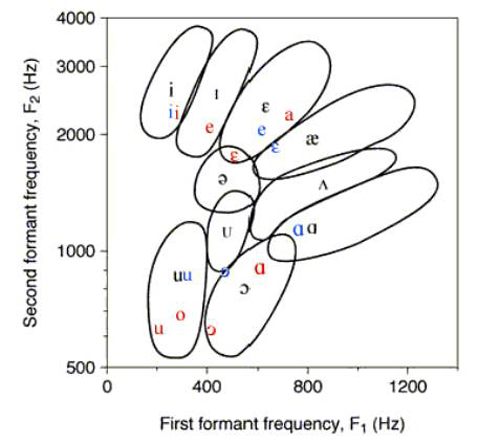
(Louis Goldstein - Haskins Laboratories ) and the plots in red are from my analysis
of the primary cardinal vowels.
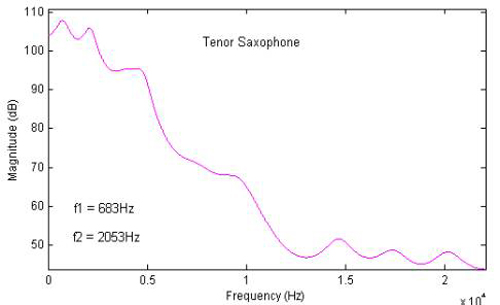
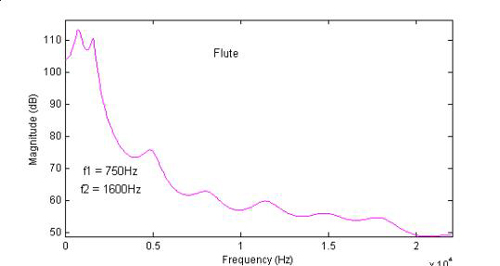
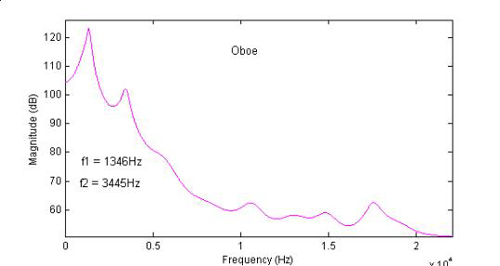
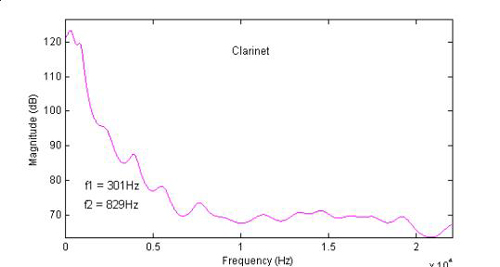
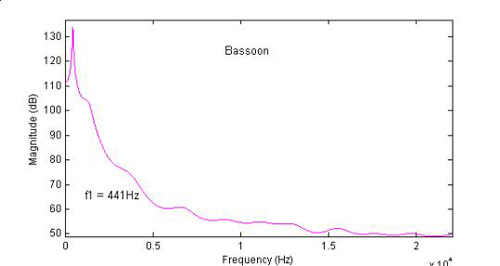
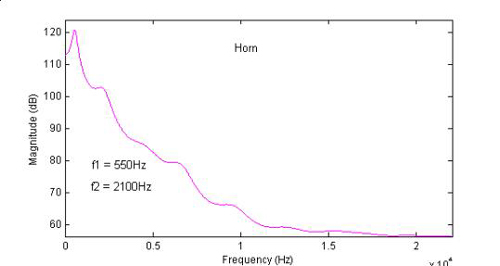
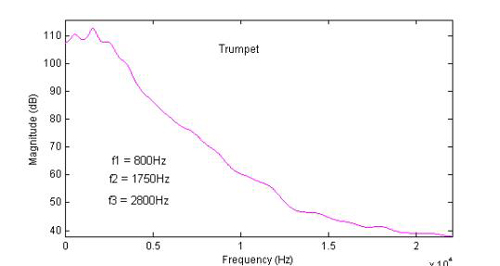
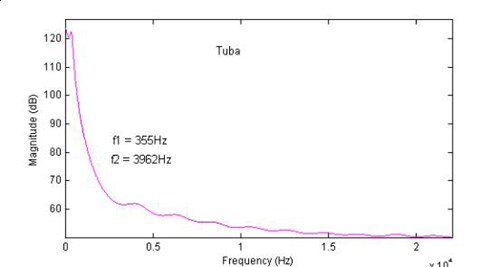
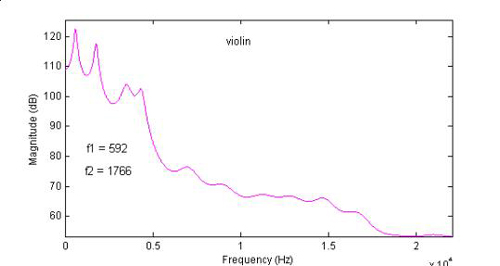
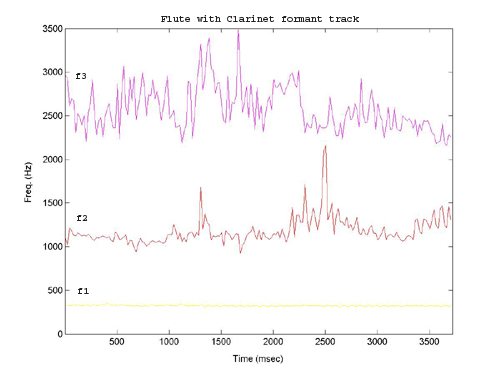
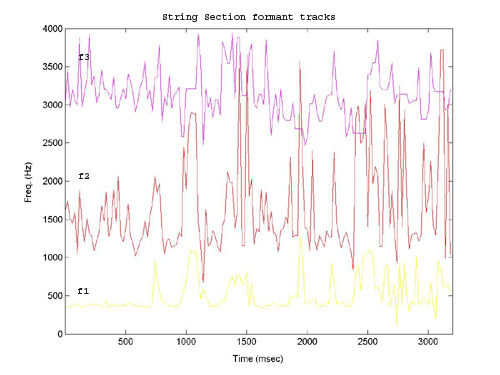
I performed a similar formant analysis of several acoustic instruments using the COLEA analysis toolkit for matlab. The results are shown in the following plots. Some instruments exhibit only one formant frequency, while others, like saxophone and violin, tended to exhibit three or four. These plots where generated with analysis of the following sound files: sax.wav, flute.wav, clarinet.wav, oboe.wav, bassoon.wav, violin.wav, cello.wav, bass.wav, allstrings.wav, flute_clar.wav. Muting, vibrato, and tounging will alter the timbre of an instrument and produce a change in these formants. It is important to understand that formant regions are independent of pitch.
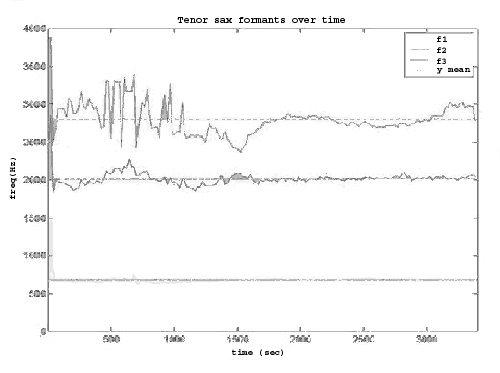
results for the formants were derived from the mean values as in this graph


What is the purpose of all this analysis?
I am not suggesting that
every single acoustic instrument or combination of instruments need be
analyzed in this way. I hope that from a generalized framework as
in the chart below, which I am calling the "vowel space", each
instrument class can be identified and the timbral mixture of particular
instruments can be accurately predicted and described within this
system.
The musical examples that follow take a different approach. Acoustic
instrument sounds or their combinations are being selected to mimic
vocal phonemes. So rather than describing acoustic timbre in terms of
phonemes, the phonemes are being emulated by acoustic instruments. These
experiments are offered as an attempt to verify the validity of a
phoneme based system for timbre classiicfation. This system is under
development and I encourage comments, questions, and feedback.
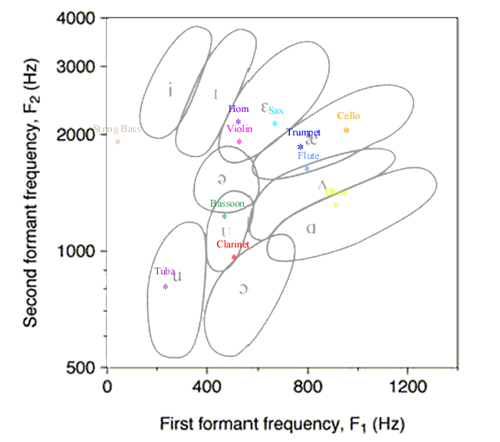
This chart shows the formant frequencies for the various
instruments plotted in the "vowel space".These values were
calculated with COLEA.
The formant chart or "vowel space" shows that each instruments, irrespective of family (brass, woodwinds, strings), exhibit formant properties which allow them to be classified in terms of a particular phoneme or pair of phonemes. Now I can say that the tuba's timbre has a 'U' sound or (oo) as in the word who, or the trumpet has an 'ae' timbre like the work actor. For a more detailed exploration of phonemes look at this UCLA linguistics site which has sounds samples for most the International Phonetic Alphabet.
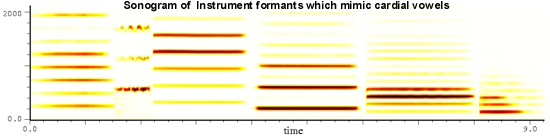
Mimicking cardinal vowels with acoustic instrument samples:
The sonogram at the top of this page shows the cardinal vowels spectrum. The sonogram below is made up of different acoustic instrument samples which closely match the formant properties of each of cardinal vowels. Compare the vocal and instrumental sound files to hear the relationship.
Spoken Cardinal Vowels
Instrumental Cardinal Vowels
Instrumental Cardinal Vowels pitch shifted for consistency
<next>