Click on the thumbnail images below to view larger versions of the pictures.
|
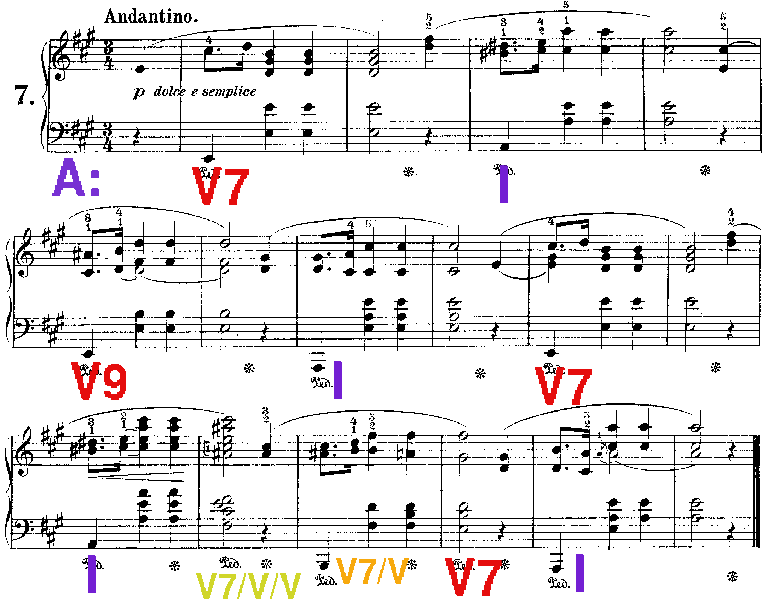
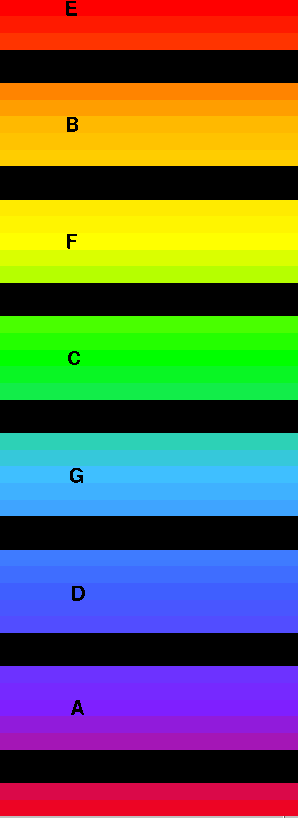
The Chord analysis is colored according to the root colors in the following pictures. |
|
The following images use color to indicate pitch/chord roots/keys. Pitches are arranged so that a fifth relationship exists between the adjacent color as shown to the right. Chromatic alterations of the diatonic pitches are related to the color of their unaltered form (e.g.: C# = slightly blue-green). Although this does not relate the distant relation between the keys if E and E-flat for example, this color mapping is most useful for seeing the relationship between keys in a tonal context (such as tonic-dominant key relations). |
|
|
The following picture relates chords and keys on various time scales in the movement. The x-axis represent time. The start of the movement is on the left-hand side, and the end of the movement is on the right-hand side.
The y-axis represents the scale of the analysis. The top of the picture represent the entire piece analysized as a single unit. The next line represents two analyses: one for the first half of the movement, and another for the second half of the movement. The movement is subsequently subdivided into more and more pieces until the bottom of the graph which divides the movement into one-beat units.
Therefore, the bottom of the picture shows the chord root, while the top of the picture shows the overall key of the movement. The intermediate regions are where modulations and tonicizations occur.
The y-axis is on a logarithmic scale. Click on the picture below to see more detail.

|
Good Features:
Problems:
|
The following images blur the vertical axis of the primary analysis picture.

|
Vertical blurring of the primary analysis picture. |

| The symmetry of the phrases are noticeable, and the twist at the end is apparent where the music cycles though the circle of fifths from F (yellow) to B (orange) to E (red) to A (purple). It is interesting to note that the piece does not start with the tonic, but rather the dominant. |