SHARK

SHARK

Using Shark to profile and optimize your code!

First and Foremost
Shark is an incredible FREE tool for profiling code. You can get into the nitty gritty of what parts of your code aren't working and where you need to optimize. It will tell you which functions in your code are taking up the most processing and provide suggestions on what to change!
Setting this up is really not THAT painful
Location: If you downloaded the developer's tools that come with the Mac, you should already have Shark available here: /Developer/Applications/Performance Tools/Shark.app
Other Things You Need: A reliable vst host, Xcode and some knowledge to tie this all together.
1. Understand your Xcode build configurations: http://developer.apple.com/documentation/DeveloperTools/Conceptual/XcodeBuildSystem/400-Build_Configurations/build_configs.html
2. Setup your Xcode Release build configuration
3. Setup Xcode to launch your VST host when you want to profile the code
You're ready to start optimizing!!
The Profiling Process
1. In Xcode, click the Debug icon (the yellow spray can) or go to the Build Menu...Build and Go (debug). Your code will compile and your VST host will magically start running.
2. Start your plug-in running in the host.
3. Open Shark
4. In Shark's window, set the combo boxes to (from left to right): Time Profile, Process and the name of your VST host process that is running.
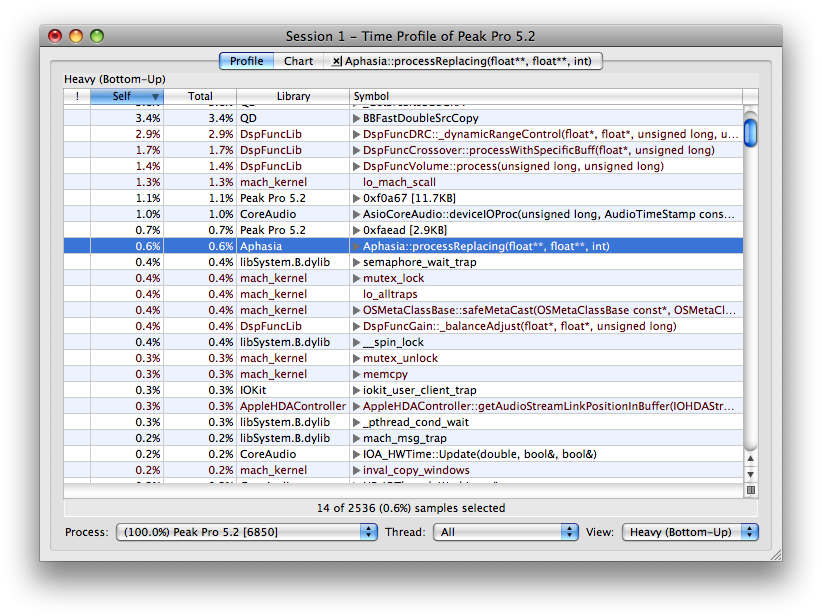
5. Press Start on Shark and it will begin sampling and profiling your code. When it is done, it will open a window of its results as shown below:
Process Output Window After Sampling

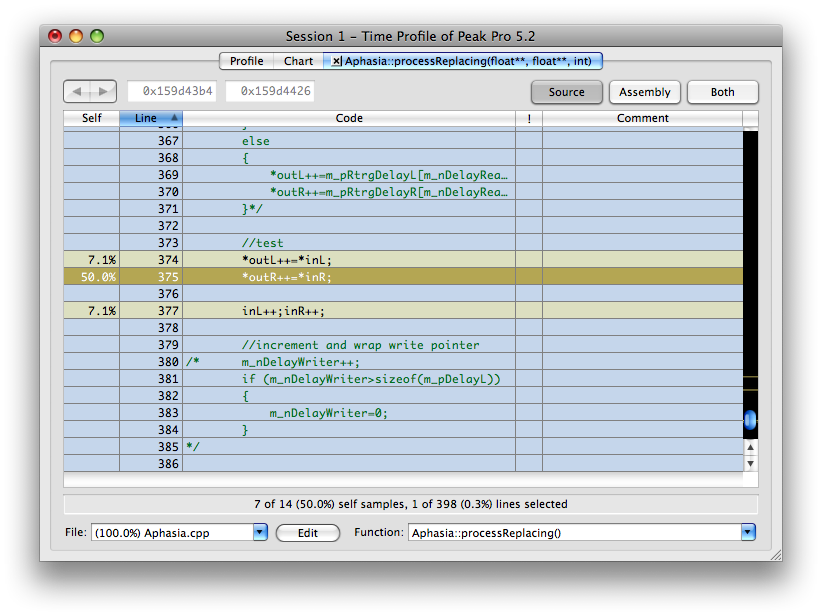
6. You will see your processReplacing function in the list. Click on it and your function's code will be revealed with statistics. If there were any problems or places where your code could be optimized, an ! will show up in the fourth column. You can click this to get suggestions on how to optimize your code!
Your Function's Code reviewed by Shark!

HAVE FUN!