Next |
Prev |
Top
|
REALSIMPLE Top
Now that you understand the very basics of digital waveguides, you will have the
opportunity to ``play'' a digital waveguide model of a plucked string in
pd. This will make it possible to answer some ``What if?'' questions.
- Download the pd patch 3-1.pd, and open it in pd.
- Ensure that the patch is not in editing mode, and check the ``compute audio'' box in the main pd window.
- To virtually pluck the string, press any key or click the ``PLUCK''
button. You may optionally check the box ``pluck repeatedly.'' Adjust the
``Master volume'' slider on the right until the volume level is comfortable.
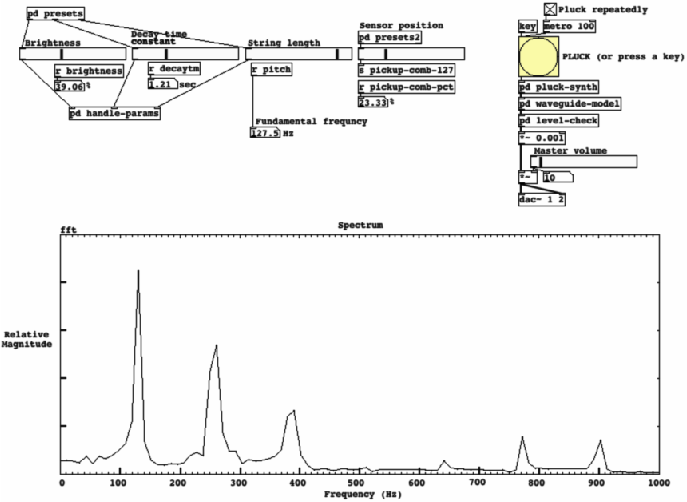
The patch should now look similar to Figure 9.
- The five sliders on the upper left calibrate the characteristics of the
vibrating string model. Will increasing the length of the
string increase or decrease the fundamental frequency? (Consider reviewing the
weighted monochord laboratory assignment
for more background information.)
- To check your previous answer, you should increase the length of the
modeled string by moving the string length slider to the right. You may either listen
to the sound of the model change, observe the spectrum change, or observe the number
printed in the ``fundamental frequency'' box change.
- Next, adjust the decay time constant
 of the model.
Review the definition of
of the model.
Review the definition of  as described in the monochord laboratory assignment. The audio
decay time
as described in the monochord laboratory assignment. The audio
decay time  is used here instead because a reasonably loud sound
will often be inaudible after it has decayed by 60dB. Verify that
the sound of the plucked string model with a shorter takes less time
to decay. Are you able to observe this on the spectrum below?
is used here instead because a reasonably loud sound
will often be inaudible after it has decayed by 60dB. Verify that
the sound of the plucked string model with a shorter takes less time
to decay. Are you able to observe this on the spectrum below?
- Now consider the brightness slider. If you have already completed the virtual acoustic guitar laboratory,
you will also know that more precisely, each harmonic has its own decay time
constant. The brightness slider adjusts the relative time constants for the
decays of the higher harmonics versus the lower harmonics. Move the
brightness slider while looking at the spectrum to determine whether a brighter
sound corresponds to the higher harmonics decaying faster or decaying more
slowly. Make a note to yourself of what the ``bright'' plucks sound like.
- The fourth slider labeled ``Sensor position'' may be used to
move the virtual sensor along the string.
Adjust the slider so that it is all of the way to the left. This means that
the sensor is almost at the end of the string. For one thing, you will notice
that the plucks sound more quiet because the amplitude is smaller. Make sure
that you understand why this is the case by looking at
plots
of the
lowest-frequency standing waves that arise in strings. You will also notice that the
string model with the sensor at the end sounds either especially bright or
especially dark (the opposite of bright). Which is it?
- What sensor locations cause the sensor to measure
no energy at the second harmonic? (Hint: You may observe this effect by viewing the spectrum while adjusting the
``Sensor position'' slider. The ``Pluck repeatedly'' toggle switch in the
upper right may help.)
- Challenge question: Derive the formula giving all string sensor
locations that will ideally cause the sensor to measure no energy at the
 th
harmonic for arbitrary . Thinking about the locations of nodes and/or
anti-nodes for standing waves may be helpful.
th
harmonic for arbitrary . Thinking about the locations of nodes and/or
anti-nodes for standing waves may be helpful.
Figure 9:
Pd patch 3-1.pd
 |
Next |
Prev |
Top
|
REALSIMPLE Top
Download waveguideintro.pdf