Consider an input audio signal ![]() . This signal might have come from a
microphone, or the pickup on an electric guitar. To learn more about the
sampling process used to obtain
. This signal might have come from a
microphone, or the pickup on an electric guitar. To learn more about the
sampling process used to obtain ![]() , consult the digital waveguide model laboratory assignment.
, consult the digital waveguide model laboratory assignment.
As discussed briefly in the monochord laboratory assignment, the spectrum of a signal gives the distribution of signal energy as a function of frequency. One commonplace situation where the concept of a spectrum arises involves the tunable equalizers found on many home and car stereo systems. In their simplest form, these equalizers may consist of two controls to adjust the level of bass and treble in the audio signal played through the system speakers. The bass control allows the user to adjust the level of the lower-frequency energy in the signal spectrum, whereas the treble control allows for the adjustment of higher frequency energy in the spectrum. Other equalizers are more advanced; many often have several controls to adjust the strength of various separate regions in the signal spectrum. In all cases, however, it is necessary to think of signal energy as a function of frequency, as provided by the spectrum concept.
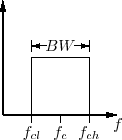
In order to separate energy from a frequency region of a signal's spectrum, a
bandpass filter may be used. An ideal bandpass filter rejects all input signal
energy outside of a desired frequency range, while giving as output all input
signal energy within that range. The range of accepted frequencies is often
referred to as the band, or passband. The frequency boundaries defining the
band,
![]() and
and
![]() , are known as the lower and upper
cutoff frequencies (respectively). These are also referred to as the band
edges. The difference between the upper and lower cutoff frequencies is known
as the bandwidth:
, are known as the lower and upper
cutoff frequencies (respectively). These are also referred to as the band
edges. The difference between the upper and lower cutoff frequencies is known
as the bandwidth:
| (1) |
| (2) |
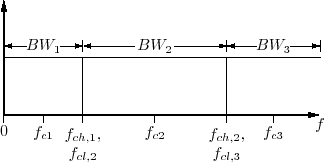
A filter bank is a system that divides the input signal ![]() into a set of
analysis signals
into a set of
analysis signals
![]() , each of which corresponds to a
different region in the spectrum of
, each of which corresponds to a
different region in the spectrum of ![]() . Typically, the regions in the
spectrum given by the analysis signals collectively span the entire audible
range of human hearing, from approximately 20 Hz to 20 kHz. Also, the regions
usually do not overlap, but are lined up one after the other, with edges,
touching, as shown in Figure 2. The analysis signals
. Typically, the regions in the
spectrum given by the analysis signals collectively span the entire audible
range of human hearing, from approximately 20 Hz to 20 kHz. Also, the regions
usually do not overlap, but are lined up one after the other, with edges,
touching, as shown in Figure 2. The analysis signals
![]() may be obtained using a collection of bandpass filters with
bandwidths
may be obtained using a collection of bandpass filters with
bandwidths
![]() and center frequencies
and center frequencies
![]() (respectively).
(respectively).
 |