The Leslie, named after its inventor, Don Leslie,10is a popular audio processor used with electronic organs and other instruments [#!Bode84!#,#!Henricksen81!#]. It employs a rotating horn and rotating speaker port to ``choralize'' the sound. Since the horn rotates within a cabinet, the listener hears multiple reflections at different Doppler shifts, giving a kind of chorus effect. Additionally, the Leslie amplifier distorts at high volumes, producing a pleasing ``growl'' highly prized by keyboard players.
The Leslie consists primarily of a rotating horn and a rotating speaker port inside a wooden cabinet enclosure [#!Henricksen81!#]. We first consider the rotating horn.
Rotating Horn Simulation
The heart of the Leslie effect is a rotating horn loudspeaker. The
rotating horn from a Model 600 Leslie can be seen mounted on a
microphone stand in Fig. ![]() . Two horns are apparent, but
one is a dummy, serving mainly to cancel the centrifugal force of the
other during rotation. The Model 44W horn is identical to that of the
Model 600, and evidently standard across all Leslie models
[#!Henricksen81!#]. For a circularly rotating horn, the source
position can be approximated as
. Two horns are apparent, but
one is a dummy, serving mainly to cancel the centrifugal force of the
other during rotation. The Model 44W horn is identical to that of the
Model 600, and evidently standard across all Leslie models
[#!Henricksen81!#]. For a circularly rotating horn, the source
position can be approximated as
By Eq.![]() (7), the source velocity for the circularly rotating horn is
(7), the source velocity for the circularly rotating horn is
Note that the source velocity vector is always orthogonal to the source position vector, as indicated in Fig. 1.1.
Since
![]() and
and
![]() are orthogonal,
the projected source velocity Eq.
are orthogonal,
the projected source velocity Eq.![]() (8) simplifies to
(8) simplifies to
Leslie Free-Field Horn Measurements
The free-field radiation pattern of a Model 600 Leslie rotating horn
was measured using the experimental set-up shown in
Fig. ![]() [#!SmithEtAlDAFx02!#]. A matched pair of Panasonic microphone elements
(Crystal River Snapshot system) were used to measure the horn response
both in the plane of rotation and along the axis of rotation (where no
Doppler shift or radiation pattern variation is expected). The
microphones were mounted on separate boom microphone stands, as shown
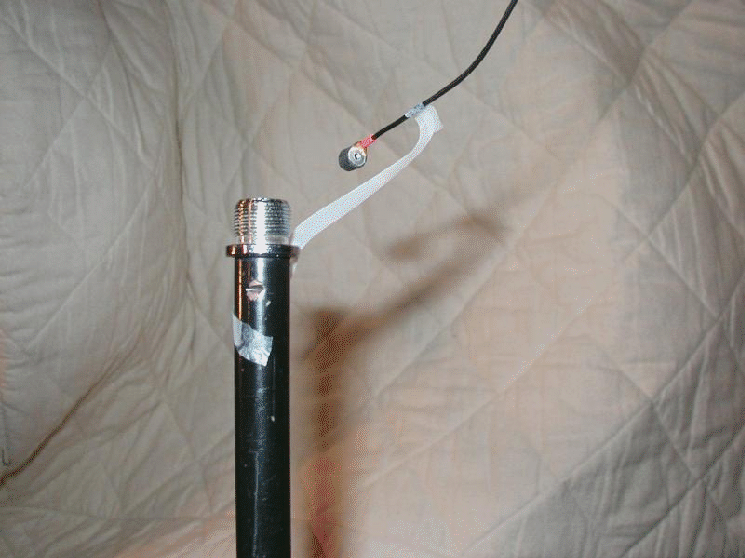
in the figure. A close-up of the plane-of-rotation mic is shown in
Fig.
[#!SmithEtAlDAFx02!#]. A matched pair of Panasonic microphone elements
(Crystal River Snapshot system) were used to measure the horn response
both in the plane of rotation and along the axis of rotation (where no
Doppler shift or radiation pattern variation is expected). The
microphones were mounted on separate boom microphone stands, as shown
in the figure. A close-up of the plane-of-rotation mic is shown in
Fig. ![]() .
.

The horn was set manually to fixed angles from -180 to 180 degrees in increments of 15 degrees, and at each angle the impulse response was measured using 2048-long Golay-code pairs [#!FosterGolay!#].
Figure ![]() shows the measured impulse responses and Fig.
shows the measured impulse responses and Fig. ![]() shows the corresponding amplitude responses at the various angles.
Note that the beginning of each impulse response contains a fixed
portion which does not depend significantly on the angle. This is
thought to be due to ``leakage'' from the base of the horn. It
arrives first since the straight-line path from the enclosed speaker
to the microphone is shorter than that traveling through the horn
assembly.
shows the corresponding amplitude responses at the various angles.
Note that the beginning of each impulse response contains a fixed
portion which does not depend significantly on the angle. This is
thought to be due to ``leakage'' from the base of the horn. It
arrives first since the straight-line path from the enclosed speaker
to the microphone is shorter than that traveling through the horn
assembly.

Separating Horn Output from Base Leakage
Note that Fig. ![]() indicates the existence of fixed and
angle-dependent components in the measured impulse responses.
An iterative algorithm was developed to model the two components
separately [#!SmithEtAlDAFx02!#].
indicates the existence of fixed and
angle-dependent components in the measured impulse responses.
An iterative algorithm was developed to model the two components
separately [#!SmithEtAlDAFx02!#].
Let ![]() denote the number of impulse-response samples in each
measured impulse response,and let
denote the number of impulse-response samples in each
measured impulse response,and let ![]() denote the number of angles
(-180:15:180) at which impulse-response measurements were
taken. We denote the
denote the number of angles
(-180:15:180) at which impulse-response measurements were
taken. We denote the ![]() impulse-response matrix by
impulse-response matrix by
![]() .
Each column of
.
Each column of
![]() is an impulse response at some horn angle.
(Figure
is an impulse response at some horn angle.
(Figure ![]() can be interpreted as a plot of the transpose of
can be interpreted as a plot of the transpose of
![]() .)
.)
We model
![]() as
as
Each column of the matrix
![]() contains a copy of the estimated
horn-base leakage impulse-response:
contains a copy of the estimated
horn-base leakage impulse-response:
The estimated angle-dependent impulse-responses in
![]() are modeled as
linear combinations of
are modeled as
linear combinations of ![]() fixed impulse responses, viewed
(loosely) as principal components:
fixed impulse responses, viewed
(loosely) as principal components:
To start the separation algorithm,
![]()
![]() is initialized to the
zero-shifted impulse response data
is initialized to the
zero-shifted impulse response data
![]() diag
diag![]() , ignoring
the tails of the base-leakage they may contain. Then
, ignoring
the tails of the base-leakage they may contain. Then
![]()
![]() is
estimated as the mean of
is
estimated as the mean of
![]()
![]()
![]() diag
diag![]() . This
mean is then subtracted from
. This
mean is then subtracted from
![]() to produce
to produce
![]()
![]()
![]() diag
diag![]() which is then then converted to
which is then then converted to
![]()
![]() by a truncated SVD. A revised
base-leakage estimate
by a truncated SVD. A revised
base-leakage estimate
![]()
![]() is then formed as
is then formed as
![]()
![]()
![]() diag
diag![]() , and so on, until convergence is
achieved.
, and so on, until convergence is
achieved.
Results
Figure ![]() plots the
plots the ![]() weighted principal components identified for the
angle-dependent component of the horn radiativity. Each component is
weighted by its corresponding singular value, thus visually indicating
its importance. Also plotted using the same line type are the
zero-lines for each principal component. Note in particular that the
first (largest) principal component is entirely positive.
weighted principal components identified for the
angle-dependent component of the horn radiativity. Each component is
weighted by its corresponding singular value, thus visually indicating
its importance. Also plotted using the same line type are the
zero-lines for each principal component. Note in particular that the
first (largest) principal component is entirely positive.
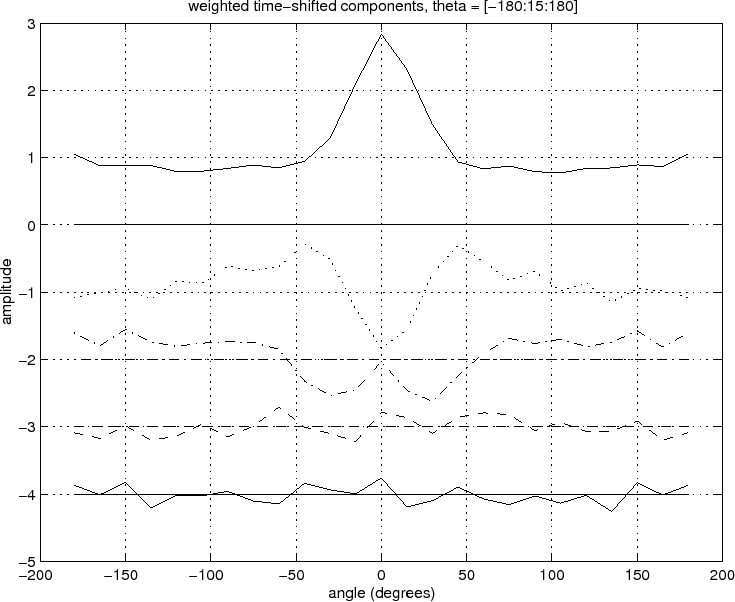
Figure ![]() shows the complete horn impulse-response model
(
shows the complete horn impulse-response model
(
![]()
![]()
![]()
![]() diag
diag![]() ), overlaid with the
original raw data
), overlaid with the
original raw data
![]() . We see that both the fixed base-leakage
and the angle-dependent horn-output response are closely followed by
the fitted model.
. We see that both the fixed base-leakage
and the angle-dependent horn-output response are closely followed by
the fitted model.

Figure ![]() shows the estimated impulse response of the base-leakage
component
shows the estimated impulse response of the base-leakage
component
![]() , and Fig.
, and Fig. ![]() shows the modeled angle-dependent
horn-output components
shows the modeled angle-dependent
horn-output components
![]() delayed out to their natural arrival
times.
delayed out to their natural arrival
times.
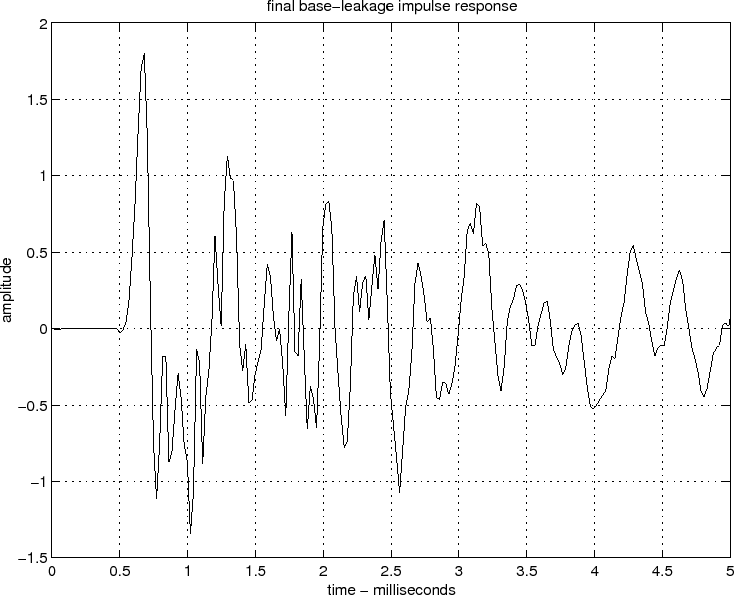

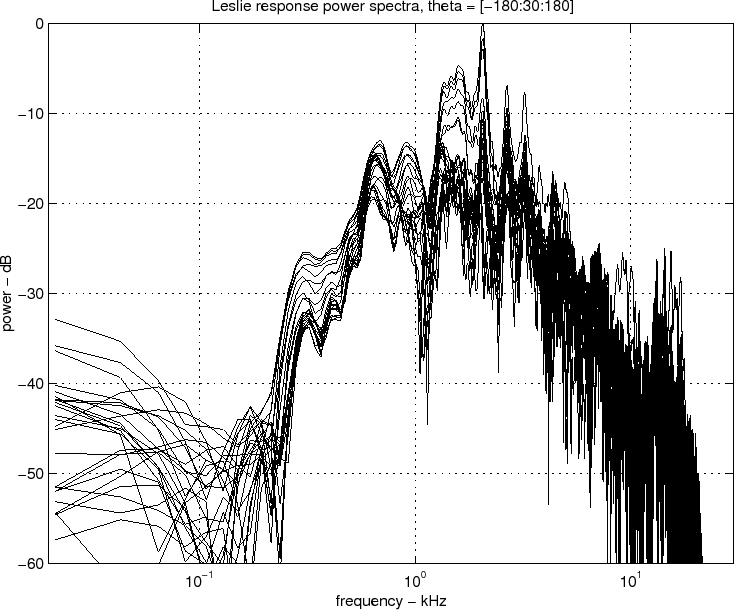
Figure ![]() shows the average power response of the horn outputs.
Also overlaid in that figure is the average response smoothed
according to Bark frequency resolution [#!SmithAndAbel99!#]. This
equalizer then becomes
shows the average power response of the horn outputs.
Also overlaid in that figure is the average response smoothed
according to Bark frequency resolution [#!SmithAndAbel99!#]. This
equalizer then becomes ![]() in Fig. 1.1. The filters
in Fig. 1.1. The filters
![]() and
and ![]() in Fig. 1.1 are obtained by dividing
the Bark-smoothed frequency-response at each angle by
in Fig. 1.1 are obtained by dividing
the Bark-smoothed frequency-response at each angle by ![]() and
designing a low-order recursive filter to provide that equalization
dynamically as a function of horn angle. The impulse-response arrival
times
and
designing a low-order recursive filter to provide that equalization
dynamically as a function of horn angle. The impulse-response arrival
times ![]() determine where in the delay lines the filter-outputs
are to be summed in Fig. 1.1.
determine where in the delay lines the filter-outputs
are to be summed in Fig. 1.1.
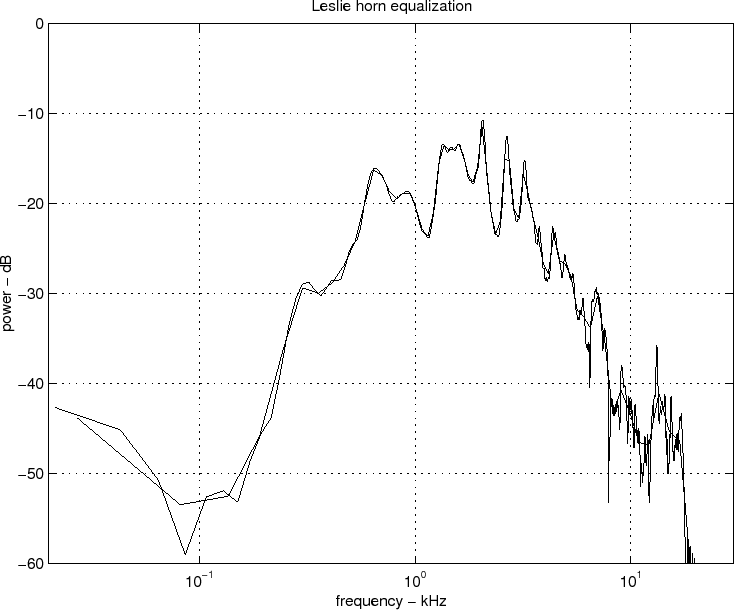
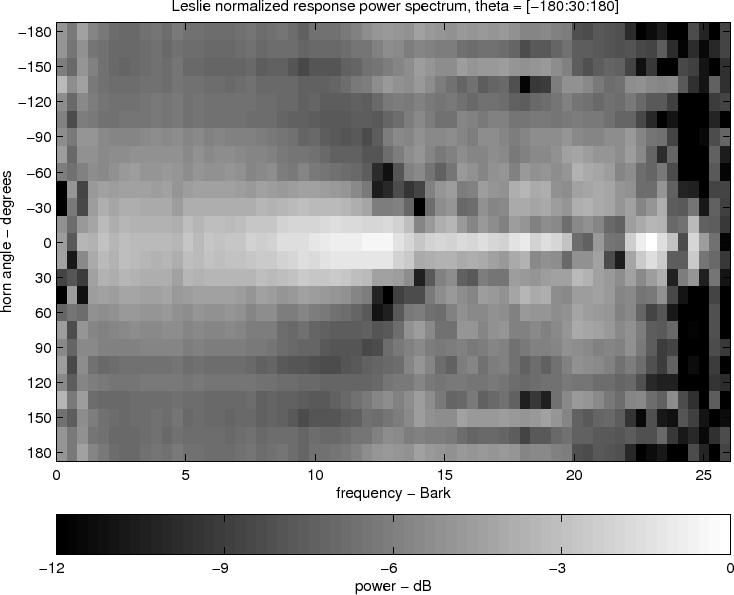
Figure ![]() shows a spectrogram view of the angle-dependent
amplitude responses of the horn with
shows a spectrogram view of the angle-dependent
amplitude responses of the horn with ![]() (Bark-smoothed curve in
Fig.
(Bark-smoothed curve in
Fig. ![]() ) divided out. This angle-dependent, differential
equalization is used to design the filters
) divided out. This angle-dependent, differential
equalization is used to design the filters ![]() and
and ![]() in Fig. 1.1. Note that below 12 Barks or so, the angle-dependence
is primarily to decrease amplitude as the horn points away from the
listener, with high frequencies decreasing somewhat faster with angle than low
frequencies.
in Fig. 1.1. Note that below 12 Barks or so, the angle-dependence
is primarily to decrease amplitude as the horn points away from the
listener, with high frequencies decreasing somewhat faster with angle than low
frequencies.
