Assignment 1-FFT: Seeing Frequencies
Due in One Week (Ideally Start of Week 4)
Deliverable: A video of you interacting with your spectrum analyzer
Email a link to your video to the teaching team
In this assignment you are asked to create a spectrum analysis plug-in, including the following:
- Create a JUCE plugin with PGM GUI
- Compute FFT
magnitude data using JUCE's
dspmodule - Connect parameters that configure the FFT analysis
- Display the FFT magnitude data in real time, thus making a real-time spectrum analyzer
Feel free to go wild with your GUI and have fun! However, your implementation should have the following components:
- Your plugin must display the real time spectrum of your input signal. There will be some delay, of course :)
- Your plugin must be controllable and have, at least, two parameters
- Spectral magnitude smoothing time (ms)
- Another parameter of your choice
- Your plugin must compute and display the spectral centroid
Getting Started
In Projucer, create a new JUCE audio plugin project with PGM support like you did in the previous assignment on PGM.
Once you've set up your project, grab the
hwFFT starter code.
Review
the differences between the
Projucer-generated PluginProcessor.h/cpp and
the starter code, which now inherits
from foleys::MagicProcessor instead
of juce::AudioProcessor directly. In the
starter code we have hooked up your fftData
and frequencies arrays to a new and incomplete
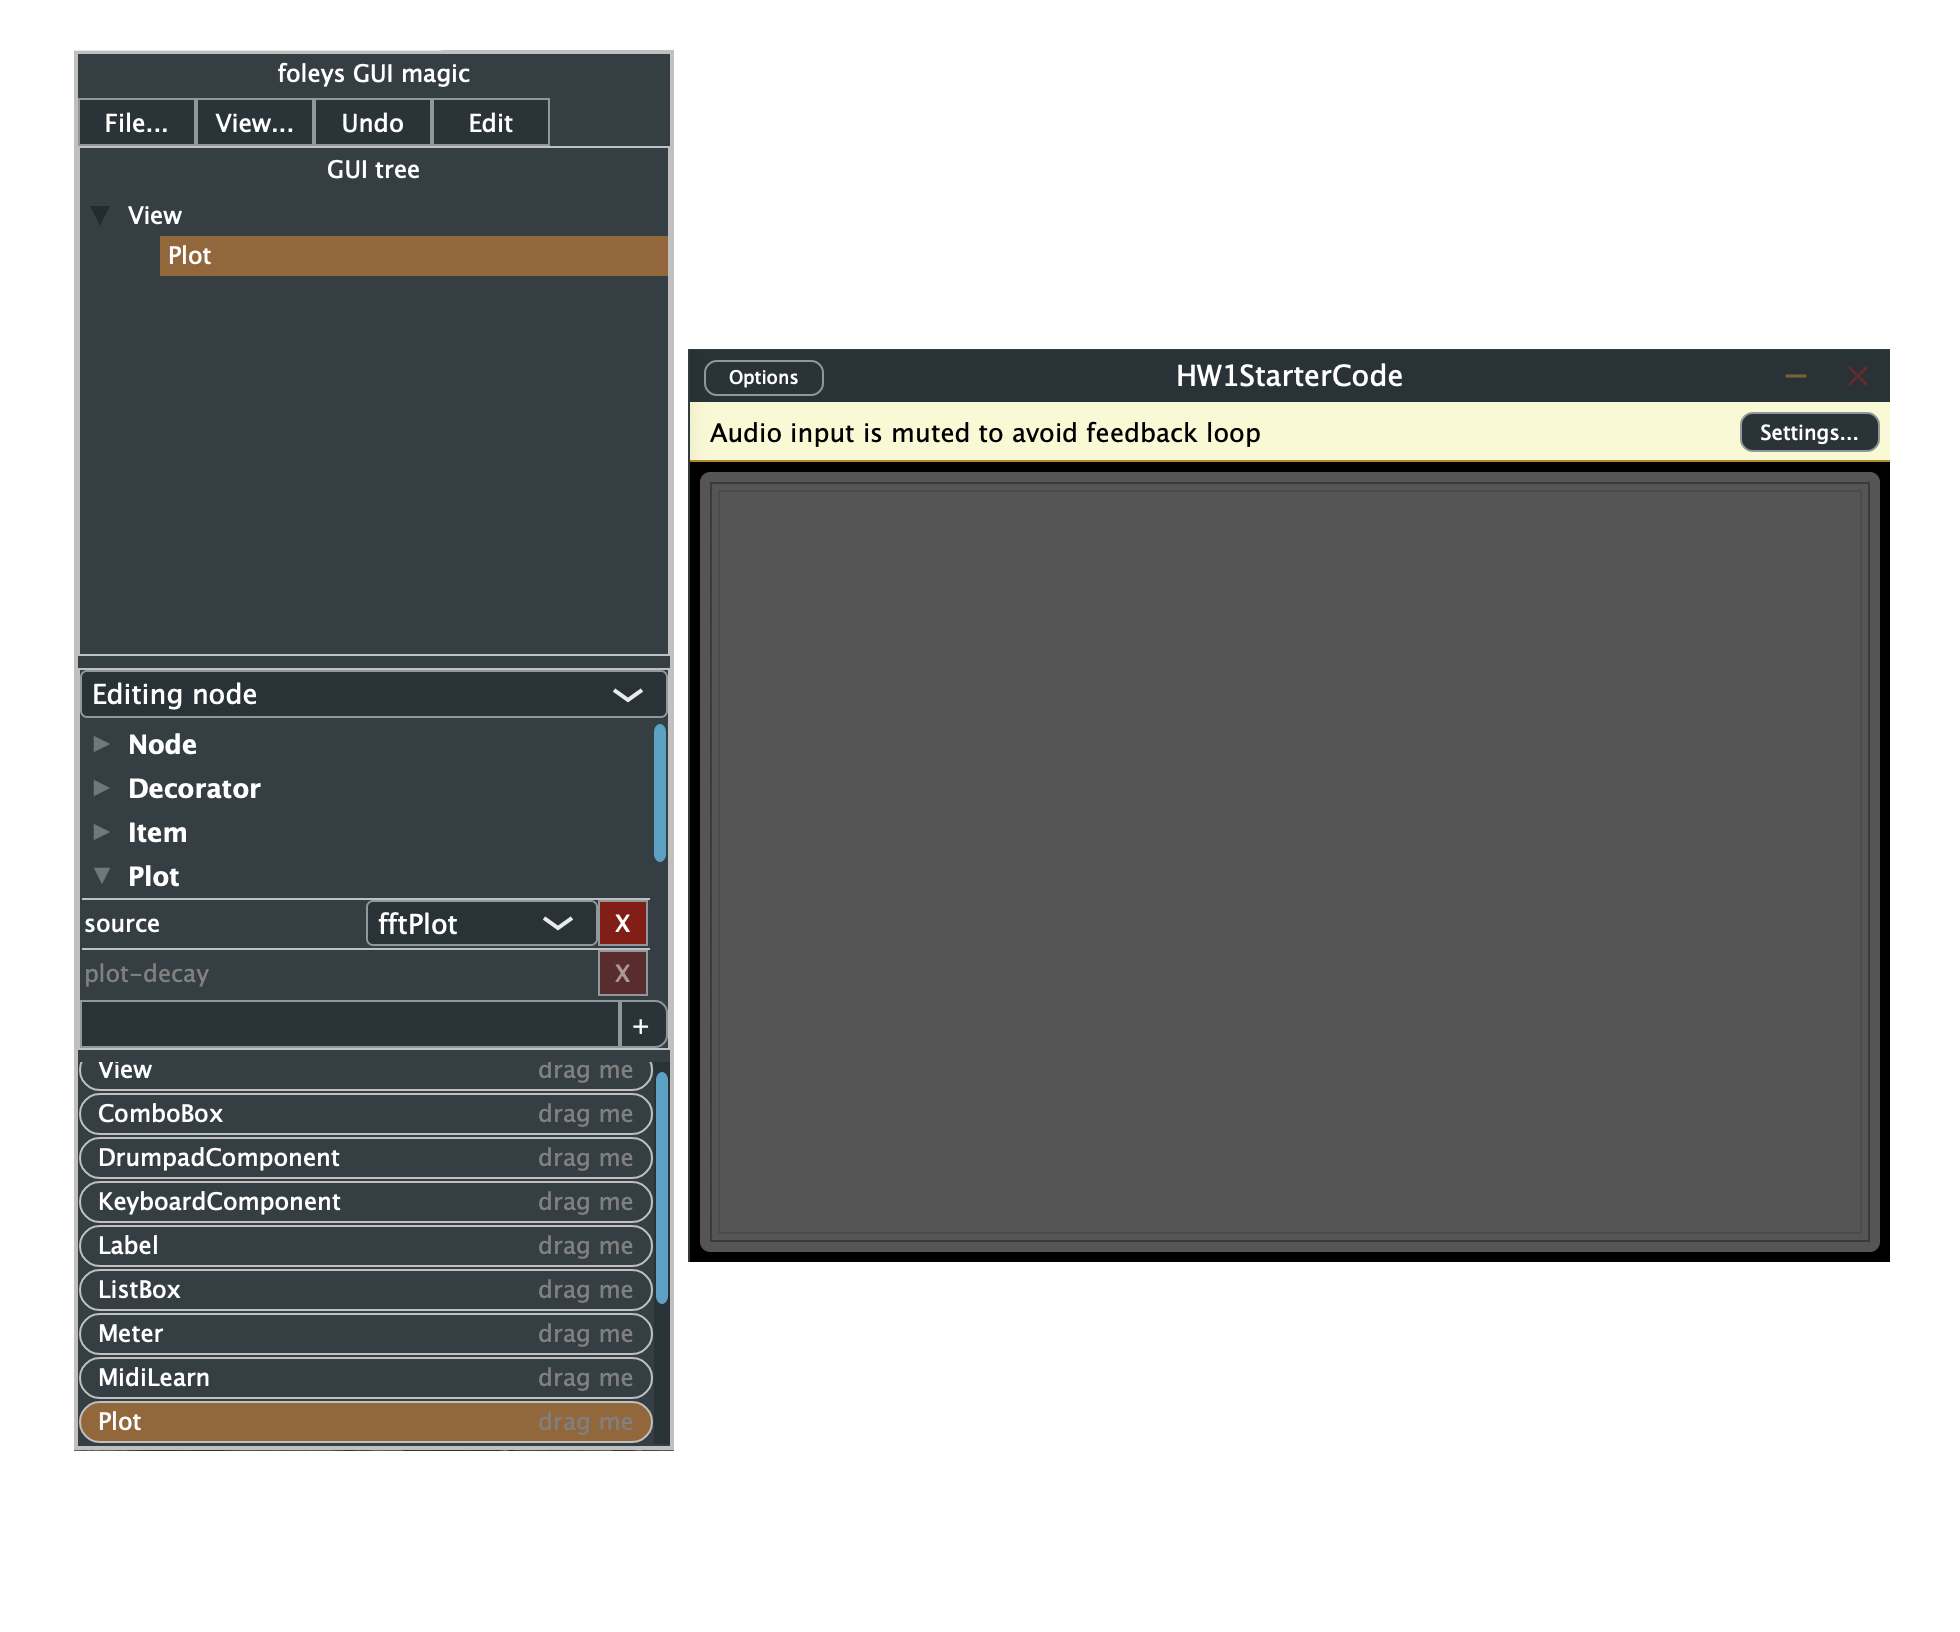
Visualizer class. Upon building and running
your plugin, you should see the PGM GUI editor, but the
PGM Plot display is blank even
though fftPlot is connected as
the source.
The following refers to the 2023 version of the starter code. We need to update it to refer to the 2024 version, which gives you a bit more to start with. Until then, start with the 2023 version, and switch to the 2024 version as your actual starting code, perhaps checking out the diffs as needed along the way.
1 The Visualizer
In your starter code you have been provided with the files Visualizer.h and
Visualizer.cpp that implement the class Visualizer. This class is derived
from foleys::MagicPlotSource. The documentation for the parent class can be found here.
The Visualizer class has two private members
which are float pointers: data
and x.
void createPlotPaths (juce::Path& path, juce::Path& filledPath, juce::Rectangle bounds, foleys::MagicPlotComponent& component); data vs x.
The function createPlotPaths updates the
arguments path and filledPath,
and these updates are used
in foleys::MagicPlotComponent's paint
method.
The bounds argument is
a juce::Rectangle containing the bounding
box of your plot. Methods such as getX()
and getY() will be useful for getting its
location on the screen and drawing your plot. The
juce::Rectangle
class
reference documentation is useful. Every JUCE
Component,
which represents a rectangular region on the screen,
uses juce::Rectangle to hold its bounds.
See the
Point, Line, and Rectangle Classes Tutorial if
anything is not clear from the reference doc
for Rectangle.
It is up to you to implement this method. A helpful example is the implementation of foleys::MagicFilterPlot.
If you choose to do a straightforward plot, please
plot data versus x on a log-log
scale with your magnitude spectra in dB. This will make
your plot look more like what we hear.
After implementing your method, check it using
the frequencies array generated
in prepareToPlay
for (int i = 0; i < FFT_SIZE/2; ++i)
frequencies[i] = i;fftData array generated in processBlock
for (int i = 0; i < FFT_SIZE/2; ++i)
fftData[i] = std::pow(10, 3)*std::sin(24.8* i/FFT_SIZE);2 FFT
Now that you have a working plot, we want to feed it real-world data by using the JUCE library FFT. Carefully read the class documentation and review this tutorial.
After capturing your FFT data, plot (at least) the magnitude spectrum in a way that is clear, and please make sure to window your data!
Allocate the necessary buffers in PluginProcessor.h and implement your signal processing code in PluginProcessor.cpp in the processBlock method. Update the fftData array with your FFT data. Change the freq array instantiation with the correct frequency lines values.
At this point you should have a working spectrum analyzer! But it could be better... it could be controllable!
3 Adding Parameters
In this section you will add parameters to your plugin, which will allow you to control the time smoothing of your FFT plot and display the spectral centroid. See this tutorial for a more in depth guide on how to add parameter and parameter listeners.
3.1 Smoothing with the Leaky Integrator
The first parameter you will implement is a leaky integrator that smooths the output of your FFT data by computing a running mean. The leaky integrator is a one-pole lowpass filter with unity gain at dc and is defined by a smoothing time-constant \(\tau\) in seconds.
Determine the leakage factor \( \lambda \) (which is the pole of your filter) as a function of \(\tau \), the sampling rate and your FFT buffer size. Your FFT update equation is then \[ FFT_{old} = \lambda * FFT_{old} + (1 - \lambda)* FFT_{new}\] Where \( FFT_{old} \) stores updated the time-averaged FFT plot and \( FFT_{new} \) is the incoming FFT data.
After implementing your leaky integrator, try hard-coding a \( \tau = \) 10 ms into you code. After compiling your code you should see less jitter and a smoother plot in your spectrum analyzer.
3.2 Controlling the Averaging Time ( \( \tau \) )
To change the value of \( \tau \) you will need to instantiate an AudioParameter in the provided createParameterLayout function.
layout.add(std::make_unique< juce::AudioParameterFloat >(paramID, paramName, juce::NormalisableRange< float >(min, max, step), default));
This line of code adds a new floating point audio parameter juce::AudioParameterFloat with a unique string ID paramID and string name paramName. Note that paramID must be a unique string and is used by the value tree to correctly identify parameters. paramName will be the name that comes up in your PGM editor. See more documentation on AudioParameters and the different types of parameters here.
juce::NormalisableRange<float> creates a floating point range based on a minimum value, maximum value, and step size. The default value is the value the parameter is initialized as. Documentation on the range class can be found here.
After creating your parameter, it is important to add a listener to your value tree state. This listener will notify the plugin when the value of your parameter is externally changed. Implement the listener in your plugin's constructor.
treeState.addListener(paramID, this)paramID is once again your parameter's unique string identifier. this is a pointer to the current class and does not need to be edited.
When your parameter changes, the function parameterChanged(const juce::String ¶meterID, float newValue) is automatically called. The newValue for a certain parameter with unqiue parameterID is passed into this function. Based on what parameter string is passed we can update the behavior of our plugin.
In the case of our leaky integrator, say we get a new value of \( \tau \) from our GUI, in parameterChanged we then update the value of \( \lambda \) that is used in our FFT update equation.
if (parameterID == "tau")
{
    // Update lambda
}
3.3 Spectral Centroid
You are now going to compute and print the spectral centroid in your plugin. You can think of the spectral centroid as a measure of brightness or center of gravity of the spectral magnitude. It may be defined as \[ \text{Spectral Centroid} = \frac{\sum_{i=0}^N f_i * |X_i|^2}{\sum_{i=0}^N|X_i|^2} \] Where \( f_i\) is the \(i\)th frequency and \( |X_i| \) is the FFT magnitude coefficient at frequency index \( i \). Many authors do not square the spectral magnitude samples, but doing so gives results proportional to power rather than amplitude.
In physics, the centroid of a uniform mass distribution gives its center of mass and may be calculated as the first moment of the mass distribution about the origin (the numerator in our spectral centroid calculation) divided by its total mass (our denominator). Thus, spectral power corresponds to mass distributed across frequencies.
Add a spectral centroid parameter to your parameter layout, but do not create a listener. This is because we don't want our spectral centroid value to change as the result of an external control. Parameters can be manually updated using the following code:
juce::Value paramToEdit = treeState.getParameterAsValue(paramID);
paramToEdit = myCalculatedValue;juce::Value object that can be can be updated internally and will then update the AudioParameter value in our GUI.
In your processBlock function, compute your spectral centroid after computing your FFT. Use getParameterAsValue() to create a juce::Value item based spectral centroid paramID. By assigning your computed spectral centroid value to the juce::Value item you will update the GUI parameter.
Use the PGM Label item and attach it to your spectral centroid parameter to print the spectral centroid in your plugin.
3.4 More parameters, (hopefully not) more problems
Now that you have a working smoothing paramter add some new parameters of your choice! Some ideas:
- dB Offset
- Window Type
- FFT Size
Congrats! You now have your own working spectrum analyzer. Play around with it and submit a video of you having some fun. Make sure that you can clearly correlate what you are doing audio-wise to what is happening on screen.
Handy References
Visualizer
- Moments and Centers of Mass nicely developed
- Spectral Centroid in Python
- MagicPlotSource reference
- MagicPlotComponent Implementation
- JUCE Rectangle class reference
- MagicFilterPlot Implementation
FFT
- JUCE FFT Tutorial
- JUCE Spectrum Analyser Tutorial
- JUCE FFT class reference
- Windowing reference
- JUCE
dspmodule intro
Parameters
- JUCE plugin parameter tutorial
- One-pole reference
- RangedAudioParameter reference
- NormalisableRange tutorial
- this pointer reference
Videos
Class recordings disussing this assignment last year:
- 2023-04-20: Full HD (1.1 GB, 1920 x 1080) | HD (0.2 GB, 1280 x 720)
- 2023-04-25: Full HD (1.1 GB, 1920 x 1080) | HD (0.2 GB, 1280 x 720)