PITCH DETECTION METHODS REVIEW
Introduction
The goal of the present paper is to review most of the works done in the field of “Pitch Detection” or “Pitch Tracking”. The topic was chosen because it will help me to guide my current research interests.
What is pitch and why are we interested in tracking it?
Let’s start trying to define what pitch is. The former definition given by Webster Dictionary states: “the property of a sound and especially a
musical tone that is determined by the frequency of the waves producing it:
highness or lowness of sound”. Certainly our psychoacoustic understanding
of the term is much more complex than that and involves the model of our hearing
system (filter banks) as well as some description of the way we psychologically
perceive the frequencies. The ANSI definition of psychoacoustical terminology
says that “pitch is that auditory attribute of sound according to which
sounds can be ordered on a scale from low to high”[1].
In most of the analysis we are going to describe, a rather simple definition is going to be used: pitch is the fundamental frequency of a harmonic signal, and even in this case the problem seems not to be satisfactory solved yet.
Some of the reasons why it is such a complex problem are: our perception of pitch covers an extremely wide range of frequencies: “ In the width of perception the ear exceedingly transcends the eye; for while the former ranges over eleven octaves, but little more than a single octave is possible to the latter” [2]; our ears sense musical pitch even in the presence of noisy signals; we can follow several pitches simultaneously and also detect slight but expressive pitch deviations (vibrato, melisma, microtonal intervals)
There are many possible musical applications for pitch detectors, such as:
- Sound transformations: sound-editing programs often include pitch estimation routines that are used as a guide for pitch-shifting and time-scaling operations.
- Capture florid melodies of world music cultures, such us Indian or Japanese melodies. These elaborate microtonal melodies cannot be properly represented in common music notation.
- Music notation program: transcribe real performances into scores.
- Midi-real signals interface: convert a signal captured by a microphone into a midi number[3].
I am particularly interested in the idea of having a good feedback between the world of “real sounds” and the one of computer generated. Seems to me a very important issue to be able to perform interactive music that might recover some of the (in my opinion) lack of spontaneity in the electronic music.
Methods
We are going to classify the different algorithms in the following categories:
- Time Domain detection
- Frequency Domain detection
- Detectors based on models of the ears
Time Domain detection:
This seems to be the more straightforward idea, which consists in looking at the input signal as a fluctuating amplitude in time domain and try to find repeating patterns in the waveform that give clues as to its periodicity.
1. Zero Crossings: A simple technique that consist of counting the number of times that the signal crosses the 0 level reference. This technique is very simple and inexpensive but is not very accurate. In fact when dealing with highly noisy signals or harmonic signals where the partials are stronger that the fundamental, the method has poor results.
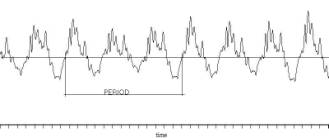
Figure 1: Harmonic signal in time domain showing that the zero crossing technique could lead to unclear results.
Preprocessing by filters may improve the accuracy of this technique.
2. Autocorrelation: the goal of the autocorrelation routines is to find the “similarity” between the signal and a shifted version of itself. The mathematical definitions is:
![]()
If the signal is periodic, the autocorrelation function y(n) also will be, and if the signal is harmonic the autocorrelation function will have peaks in multiples of the fundamental frequency. This technique is most efficient at mid to low frequencies. Thus it has been popular in speech recognition applications where the pitch range is limited.
Depending on the frame length, autocorrelation could be extremely expensive involving many multiply-add operations. There is although a cheaper way to calculate it using FFT[4]
3.
Maximum
Likelihood: Noll[5]derived an
optimal way for pitch detection in the time domain. He went on to actually
prove that his method is actually maximum likelihood. To describe his method,
consider a length T of a periodic signal r(t) with an unknown period to.
Break up the signal into N segments of length t; (1<t≤ T), i.e.
![]() 0≤b<t
0≤b<t
Figure 2:
signal broken into N segments of length t plus one segment of length b.
Now add these segments (coherently) according
to:
These segments will add coherently when t = to. Thus, we can form the objective function:
![]()
and maximize it to obtain to.
However, J(t) is not unimodal but rather has many peaks as
is usually the case with ML objective functions. For if J(t) peaks at t= to,
then it also peaks at t= mt0 if m divides N, i.e. J(t) will have almost periodic local maxima.
4. Adaptive Filter: Many approaches could be implemented using this technique developed by Prof. Bernard Widrow, such as:
a. Narrow band pass filter: The input signal is sent into a narrow band pass filter. Both the unfiltered and filtered signals are routed to a difference detector circuit. Then the output is fed back to control the center frequency of the band pass filter, forcing the filter to converge to the frequency of the input signal

Figure 3: Pitch detector based on an adaptive filter scheme.
b. Optimum comb method[6]: This method seeks to find a comb filter[7] that minimizes its input signal. The notches of the comb filter must be adaptively tuned to the dominant frequency of the input.
c. Adaptive line enhancer: I have implemented the structure showed in the following block diagram:
Figure 4: Adaptive Line Enhancer for pitch detection.
It doesn’t show any significant improvement with respect to the time domain methods.
5. Super Resolution Pitch Determination[8]: This method uses the idea that the correlation of two adjacent segments is very high when they are spaced apart by a fundamental period or a multiple of it. The method quantifies the degree of similarity between two adjacent and non-overlapping intervals with infinite time resolution by linear interpolation.
Frequency Domain detection:
The typical analysis consist on breaking the signal into small frames, multiply by a window and get the short time Fourier transform (STFT) of the frame. If the signal is periodic the Fourier transform will show peaks in multiples of the fundamental frequencies, the following algorithms describe ways of finding which peak corresponds to the fundamental frequency.
One problem of this method is the fact that the STFT divides the audio bandwidth into a set of equally spaced frequency channels of bins where each channel is n Hz apart from its neighbors. Since human pitch perception is basically logarithmic, this means that low pitches may be tracked less accurately than high pitches.
1. Harmonic Product Spectrum: The fundamental frequency can be determined by measuring the frequencies of its higher harmonic components[9] and computing the greatest common divisor of these harmonic frequencies[10]. The greatest common divisor can be determined by making an entry to a frequency histogram for each harmonic frequency and at integer divisions of the harmonic frequency. The frequency at the peak of the histogram represents the greatest common divisor, and hence the fundamental frequency. Some nice features of the method include: inexpensive, immune to additive and multiplicative noise, adjustable to different kind of inputs (changing the number of harmonics to consider or replacing multiplication by adds)
Figure 5: Harmonic Product Spectrum implementation
2. Cepstrum: The term “cepstrum “[11] is formed by reversing the first four letters of “spectrum”. The idea is to take the Fourier transform to the log-magnitude Fourier spectrum. Thus, if the original spectrum belongs to a harmonic signal, it is going to be periodic in the frequency representation, and taking the FFT again it will show a peak corresponding to the period in frequency, thus we can isolate the fundamental period. It can be also interpreted as a de-convolution process. If the input signal is produced by a train of impulses convolved with a filter they are going to be multiplied in the frequency domain, then applying log would transform the multiplication in addition. And applying FFT again would de-convolved the original signal obtaining the fundamental frequency.
Figure 6: Convolution in time= multiplication in frequency, that can be transform into addition using log.
Figure 7: Taking FFT and filtering the signal the fundamental period can be identified.
3. Maximum Likelihood: the idea here is to correlate the frame in the frequency domain with all possible windowed train of impulses, so that the higher correlation is going to occur in the frequency where the fundamental is, graphically this is the way it is implemented:

Figure 8: Implementation of Maximum likelihood in frequency.
There have been intents to detect pitch using other type of transformations like wavelet[12], with not so clean results.
Detectors based on models of the ears:
Perceptual Pitch Detector: Implemented by M. Slaney and R Lyon this pitch detector is based
on Licklider’s “Duplex Theory” of pitch perception[13].
This approach accurately models how humans perceive pitch. It correctly
identifies the pitch of complex harmonic and inharmonic stimuli, and is robust
in the face of noise and phase changes. This perceptual pitch detector combines
a cochlear model with a bank of autocorrelators. By performing an independent
auto-correlation for each channel, the pitch detector is relatively
in-sensitive to phase changes across channels. The information in the correlogram[14]
is filtered, nonlinearly enhanced, and summed across channels. Peaks are
identified and a pitch is then proposed that is consistent with the
peaks.
Figure 9: Three stages of neural processing
used in the algorithm.
References
[1] Curtis Roads, “The Computer Music Tutorial”, The MIT Press, 1998.
[2] Puckette, Apel, Zicarelli, “Real-time audio analysis tools for Pd and MSP“
[3]
Slaney, Lyon “A perceptual Pitch Detector” http://www.interval.com/~malcolm/pubs.html
[4] Hui-Ling Lu, “A Hybrid Fundamental Frequency Estimator for Singing Voice”
[5] Serra, “Pitch Detection” Musical Sound
Modeling with Sinusoids plus Noise.
www.iua.upf.es/~xserra/articles/msm/pitch.html
[6] Tristan Jehan, “Pitch Detection” http://www.cnmat.berkeley.edu/~tristan/Report/node4.html