_______________________________________________________________________________________________________________
John Nolting
CCRMA 2007
________________________________________________________________________________________________________________
220C Quarter Project
Modeling the Emu Systems SP-12
This is a project page describing the progress of my current 220C quarter project.
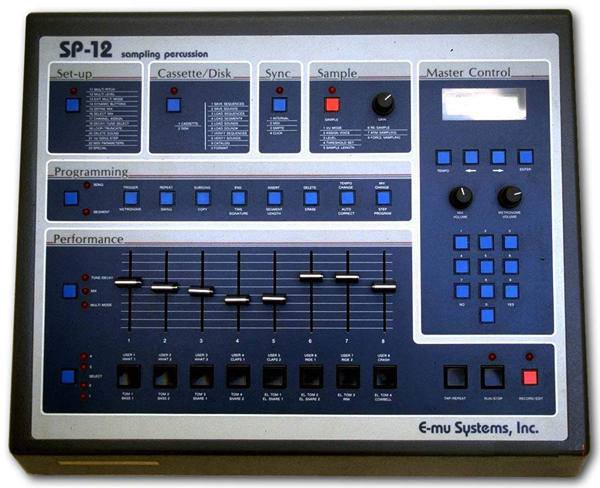
The Emu SP-12 is a sampler/drum machine unit that was released in the 80's. It allows the user to sequence loops using either internal drum sounds or sounds sampled into the machine. The machine allows for a total of 5 seconds of sampling time, which is separated into two banks of 2.5 seconds each. After sampling a sound into the SP-12, the user is able to edit the length at both the start and stop points, the tuning of the sound, the decay of the sound, loop points, and also are able to send the sound through an analog dynamic filter.
The goal of this project is to develop a program that allows the user to input some .wav file, and get back a sound that sounds like it was sampled by the Emu SP-12. This project is both a study of modeling equipment through circuit analysis/testing, and a study of why the dirty sound of the SP-12 sound is so popular.
The SP-12 samples at a lo-fi 12-bit sampling rate near 27k Hz. This is far below the required 40k Hz required to avoid aliasing, and the 12-bit quantize rate is low enough to cause quantize errors. This sound shaped much of the sampled drum sounds in Hip Hop music in the1980's and 1990's (take a look at music by Pete Rock and CL Smooth). The SP-12 machines are still sought after today by collectors and producers catching around $500 each on Ebay. This is $100 per second of sampling time.
Today, this machine is often used to sample in drum sounds, such as kicks and snares, and then re-record them from the SP-12 into a computer to be used with a modern sequencer. In other words, it is used to make recorded drum sounds gritty. Of course, it is still used to compose finished beats using the SP-12's built-in sequencer, but the sequencer will not be modeled in this project.
A List of Details:
SP-12 stands for Sampling
Percussion at 12 bits
Sampler/Drum machine with sequencer
8 velocity sensitive pads, 8 control sliders
8 voice polyphonic (8 outputs)
12-bit, 27500 KHz sampling
Standard with 1.2 sec (48Kb), Turbo with 5 sec (192Kb)
100 Patterns
100 Songs
MIDI, SMPTE
Manufactured 1985-1987
24 internal drum samples, 8 user samples
dynamic analog filter on output channels 1,2 (SSM2044 ship)
-this is a 4-pole time-varying low pass filter
Edit samples using truncate and
decay/detune
Why/How people use it:
Makes drums sound really hard and gritty
Detune function for samples
-sample in a sound from a vinyl record at 45 rpm
-detune to original pitch, which adds gritty sound to sample
Machine adds it's own sound, which can be recognized
Icon machine used by DJ Premier, Beastie Boys
Real time sequencer
-same feel as Roger Linn sequencer
Real-time volume/detune control using sliders
Beefy low pass filters
Project Status:
The schematic of the SP-12 was very hard to find. I was able to track down a pdf of the service manual from a site called emulatorarchive.com. This pdf includes schematic diagrams and descriptions of the circuit. The pdf version costs $15. I was hoping to find a free version for download, but I didn't find one. After receiving the schematics I was happy to find that the service manual was very thorough and gives a full circuit diagram..
After sampling a series of drum sounds with the SP-12 from vinyl records and comparing them to the original sample, it was found that the analog dynamic filter, and the detune effect had the most dramatic changes on the sample. The detune effect is particularly interesting because it makes the aliasing in the SP-12 very apparent.
Some Tests:
A beat made entirely by sampling records with the SP-12 and sequencing the sounds within the SP-12 is here (24MB).
Running a kick drum through the various analog filter settings sounds like this .
Running a snare drum through the analog filter sounds like this .
Detuning a drum kit sounds like this .
Sampling a sine sweep gives a good example of aliasing in the SP-12. A sine sweep modified by several settings of the detune feature sounds like this .
Sampled white noise ran through the 4 pole dynamic analog filter shows that is it low pass and time varying. Sending the noise to different outputs sounds like this . This file starts with output 8 and continues down to output 1.
What Was Done For Modeling:
There isn't one direct path to modeling an audio device. Depending on the equipment, several types of modeling might need to be considered. For example, a mechanical audio device like a spring reverb might be modeled using 'physical modeling', where physics based equations are used to build digital filters. Circuit analysis can be used to determine what will happen when an audio signal is passed through a particular circuit. Passing specific audio test signals can be passed through a device and the output can by analyzed vs. the original input signal (in some cases an impulse response can be generated, such as with sine sweeps sent in to reverbs).
After reviewing the complexity of the SP-12, it was immediately realized that a few different types of techniques would need to be implemented. Some of the techniques used are discussed below:
Circuit modeling technique: One of the major parts of the input circuit of the SP-12 is a fairly complex circuit used for anti-aliasing. This circuit is 'static' in the sense that it can't be modified by the user. If the effects of the circuit could be modified by the user, an exact solution for the circuit would have to be determined. An exact solution means that the circuit analysis would have to be done by hand, which would result in a formula that fully describes the circuit. This formula would have coefficients that could be changed in relation to modifications the user might make. In the case of the anti-aliasing filter, we did not necessarily need an exact solution, so we used a program called LTSpice. This program allows the user to draw the circuit, insert parameters that describe all the components of the circuit, and then run different types of analysis on the circuit to see what it's doing. This particular program also allows the user to send an audio input into the circuit and it will return the affected audio sound as an output. This doesn't run in real-time, but the program is free. In our case, we ran tests that returned data describing the transfer function of the anti-aliasing filter. This data was then read into Matlab, which could then re-implement the filter based on the data.
Testing technique: The control sliders on the SP-12 are not continuous. For example, when the slider is being used to control detune, the detuning changes in steps at different positions of the fader. The sound does not detune smoothly as the fader moves. In order to get the correct tuning of the aliasing and detuning, the number of steps and the amount of detune needs to be determined. A 1KHz sine wave was sampled with the SP-12. A multi-meter was connected to the ground and control voltage output of the slider in order to track the control voltage values being returned by the slider. The slider was set to control detuning in the SP-12 and was moved to the highest position. The fader was slowly moved downward, and the sample was triggered continuously (by banging on the trigger pad like crazy). At each change in pitch, the corresponding control voltage range was recorded in Microsoft Excel. We found that the slider has 16 different steps of detuning. The detuned audio sample was recorded at each of the steps. So, at this point, we have 16 recorded audio samples of the 1KHz sine wave that is detuned to 16 different pitches. We also have control voltage values of the slider at each of those steps. Each of the 16 new pitches were analyzed with a modified version of findpeaks.m . This returned a value that corresponded the frequency of each of the 16 steps. It was found that the standard detune range spanned from ratios of about 1.5 (high pitch) to 0.65 (low pitch). This was because the 1KHz signal changed from 1KHz to 1.5KHz at the highest detune setting, and it changed from 1KHz to about 650Hz at the lowest setting. These ballpark ratios were then transferred into the detuning script that written in Matlab by David Yeh. The frequency values were not exact, but they were a good starting point. After that, the real detuned output of the SP-12 was compared to detuned outputs generated by the Matlab script until the pitches were perceptually equal.
Matlab: Several scripts were written during testing and during implementation of the SP-12 model. Some of the scripts, such as findpeaks, were used just to obtain data from tests. Some scripts handled implementing the anti-aliasing filter, and detuning.. This is were the guts of the software lie.
After working with David Yeh for a few weeks on this project, he decided it was an important topic and wrote a paper about our findings and some of his research. The paper was submitted to ICMC. The paper will be posted when it is accepted for publication.
David worked on the Matlab implementation of the SP-12 based on the data we collected. The Matlab script currently models all of the important parts of the SP-12 except for the 4 pole dynmaic analog filter. More data was collected on this filter and will be implemented soon.
Some Matlab plots comparing a sinusoidal log sweep sampled by the SP-12 and ran through David's script:
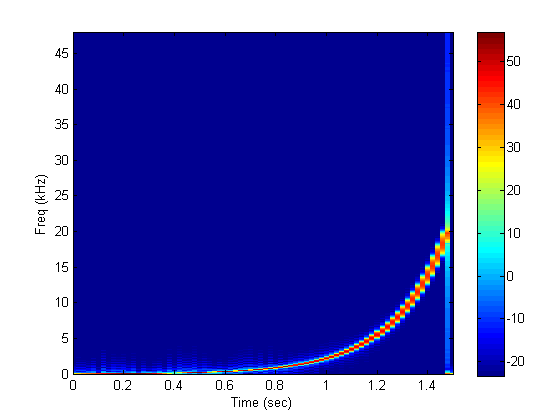
Original Log Sweep

SP-12 Sampled Log Sweep

Matlab Algorithm Sampled Log Sweep

SP-12 Sampled Log Sweep at Lowest Detune Setting

Matlab Algorithm Sampled Log Sweep at Same Low Detune Setting
Pay close attention to the frequency scale. The graphs show that the Matlab output reflects where it is supposed to.
the listening test....
After spending some time retuning the Matlab script, the following test was generated. Some of the comparisons are both SP-12, and some are both the Matlab script. And of course, some are the Matlab and SP-12 side by side. Send me an email and tell me which is which....
The original samples are here:
The original sample was detuned to the lowest detune setting of the SP-12...
Which of the following are sampled by the SP-12, and which are the Matlab script?
please email me with your results.. nolting@ccrma.stanford.edu