Next |
Prev |
Up |
Top
|
JOS Index |
JOS Pubs |
JOS Home |
Search
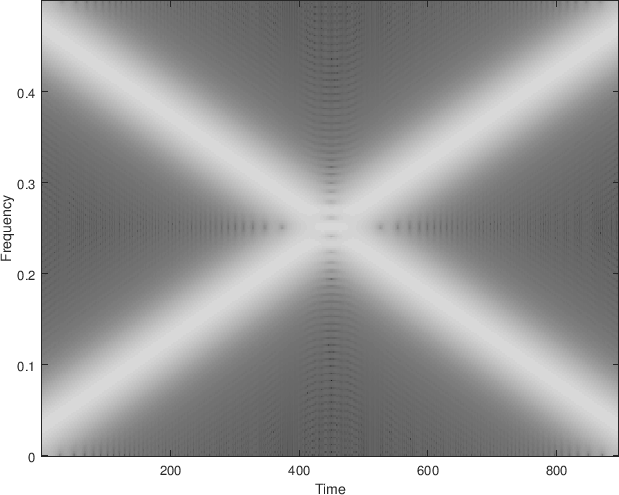
N=512; M=64;
specgram(c+fliplr(shift(c,-2)),N,1,M,M-1);
% specgram(sig,Nfft,fs,winlength,novlp);
Next |
Prev |
Up |
Top
|
JOS Index |
JOS Pubs |
JOS Home |
Search
[Comment on this page via email]